A fluorescence in situ hybridization screen for E26 transformation-specific aberrations: identification of DDX5-ETV4 fusion protein in prostate cancer - PubMed (original) (raw)
. 2008 Sep 15;68(18):7629-37.
doi: 10.1158/0008-5472.CAN-08-2014.
Rohit Mehra, Saravana M Dhanasekaran, Jindan Yu, Anjana Menon, Robert J Lonigro, Xiaosong Wang, Yusong Gong, Lei Wang, Sunita Shankar, Bharathi Laxman, Rajal B Shah, Sooryanarayana Varambally, Nallasivam Palanisamy, Scott A Tomlins, Chandan Kumar-Sinha, Arul M Chinnaiyan
Affiliations
- PMID: 18794152
- PMCID: PMC2760292
- DOI: 10.1158/0008-5472.CAN-08-2014
A fluorescence in situ hybridization screen for E26 transformation-specific aberrations: identification of DDX5-ETV4 fusion protein in prostate cancer
Bo Han et al. Cancer Res. 2008.
Abstract
Recurrent gene fusions involving E26 transformation-specific (ETS) transcription factors ERG, ETV1, ETV4, or ETV5 have been identified in 40% to 70% of prostate cancers. Here, we used a comprehensive fluorescence in situ hybridization (FISH) split probe strategy interrogating all 27 ETS family members and their five known 5' fusion partners in a cohort of 110 clinically localized prostate cancer patients. Gene rearrangements were only identified in ETS genes that were previously implicated in prostate cancer gene fusions including ERG, ETV1, and ETV4 (43%, 5%, and 5%, respectively), suggesting that a substantial fraction of prostate cancers (estimated at 30-60%) cannot be attributed to an ETS gene fusion. Among the known 5' gene fusion partners, TMPRSS2 was rearranged in 47% of cases followed by SLC45A3, HNRPA2B1, and C15ORF21 in 2%, 1%, and 1% of cases, respectively. Based on this comprehensive FISH screen, we have made four noteworthy observations. First, by screening the entire ETS transcription factor family for rearrangements, we found that a large fraction of prostate cancers (44%) cannot be ascribed to an ETS gene fusion, an observation which will stimulate research into identifying recurrent non-ETS aberrations in prostate cancers. Second, we identified SLC45A3 as a novel 5' fusion partner of ERG; previously, TMPRSS2 was the only described 5' partner of ERG. Third, we identified two prostate-specific, androgen-induced genes, FLJ35294 and CANT1, as 5' partners to ETV1 and ETV4. Fourth, we identified a ubiquitously expressed, androgen-insensitive gene, DDX5, fused in frame with ETV4, leading to the expression of a DDX5-ETV4 fusion protein.
Figures
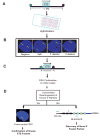
Figure 1. Schematic approach for the comprehensive FISH screen of ETS aberrations in prostate cancer
A FISH-based high-throughput screening strategy was utilized to evaluate all 27 ETS transcription factors. A, A split probe FISH approach was utilized with ~1 Mb probes flanking ETS breakpoints and applied to a prostate cancer TMA for screening genetic rearrangements involving ETS family genes. For the detection of ETV1, ETV4, and ETV5 rearrangements, in which breakpoints have been already characterized, BACs for split probes were used as described previously (–9, 11). The ETS gene is indicated by the blue box, with the direction of transcription indicated by the arrow. 5′ and 3′ BACs are indicated in ovals, indicating the probe color in the accompanying images. B, Possible outcomes from FISH-based screening of prostate cancer. Green and red arrows show individual signals, while yellow arrows indicate co-localized signals in 4′6-diamidino-2-phenylindole stained nuclei. A representative case lacking any ETS rearrangement indicated by two pairs of co-localized green and red signals (yellow arrows). A translocation (split) is indicated by one pair of split 5′ and 3′ signals. A deletion is indicated by loss of one 5′ or 3′ signal. C, If the 1Mb split probes suggested an aberration, probes tightly flanking the gene of interest (100~200 Kb) were applied on tissue sections to confirm aberrations identified by the initial screening. D, For cases rearranged for both ETS gene and known 5′ partners, a fusion probe FISH assay was performed to confirm potential gene fusion; in cases with only ETS gene rearrangement, RLM-RACE was utilized to identify novel 5′ partners of ETS genes.
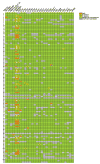
Figure 2. Summary matrix of ETS and 5′ fusion partner aberrations in prostate cancer
Rearrangement status of the 27 ETS family genes and their known 5′ fusion partners were assessed in 110 clinically localized prostate cancer by FISH analysis in triplicate tissue cores. Patient case numbers are shown on the left of the heatmap. Each row represents a single patient and each column represents FISH evaluation for ETS family gene or a known 5′ fusion partner. Color key signifies respective aberrations or availability. (*, BACs used for detection of ERG gene rearrangement were also utilized to detect ETS2 gene aberration because of proximity of the two genes. Similarly, **, BACs used for detection of EHF aberrations were also utilized to detect ELF5 gene rearrangements; ***, BACs used for detection of FLI1 were also utilized to detect ETS1; ****, BACs used for detection of ELK4 were also utilized to detect SLC45A3 aberrations. #, Due to the very close chromosomal locations of ELK4 and SLC45A3, FISH split probes could not distinguish rearrangements between the two genes individually in Case nos. 39 and 67).
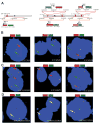
Figure 3. Identification of SLC45A3 as a novel 5′ fusion partner for ERG
A, Schematic of BACs located 5′ and 3′ to SLC45A3 and ERG used as probes for interphase FISH. Chromosomal coordinates are from the March 2006 build of the University of California Santa Cruz (UCSC) Genome Browser. BACs are indicated as numbered rectangles. Genes are shown with the direction of transcription indicated by the arrowhead and exons indicated by bars. B, FISH was performed using BACs as indicated with the corresponding fluorescent label on formalin-fixed paraffin-embedded tissue sections for split signal assay of the SLC45A3, ERG respectively and fusion of the 5′ to SLC45A3 and 3′ to ERG. Split signals are indicated by red and green arrows, and fused signals are indicated by yellow arrows. For all assays, at least 50 nuclei were evaluated.
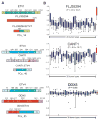
Figure 4. Identification of 5′ fusion partners FLJ35294, CANT1 and DDX5 in prostate cancer
A, Schematic of FLJ35294-ETV1 (PCa_54), CANT1-ETV4 (PCa_46) and DDX5-ETV4 (PCa_85) fusions identified by 5′RACE analysis. The numbers in the boxes represent exons. The numbers above the boxes indicate the last base of each exon. Untranslated regions are represented in lighter shades (FLJ35294 is a predicted transcript with an uncharacterized gene structure). #, Evidence for exon 1a, b and c for CANT1 gene is based on EST sequence alignments from the March 2006 build of the UCSC Genome Browser; EST accession number is DB045820. B, A plot of expression of FLJ35294, CANT1 and DDX5 genes in prostate cancer (red) compared with 28 other cancer types (blue) based on the International Genomic Consortium s expOdata set accessed in the Oncomine dataset (11). The significance value of expression in prostate cancer versus all other tumors is indicated. Box and whisker plots show the median and 10th and 90th percentiles in normalized expression units.
Figure 5. Confirmation of FLJ35294:ETV1, CANT1:ETV4 and DDX5:ETV4 fusions by FISH
A, Schematic of BACs located 5′ and 3′ to ETV1, ETV4, FLJ35294 and CANT1 used as probes for interphase FISH. Chromosomal coordinates are from the March 2006 build of the UCSC Genome Browser. BACs are indicated as numbered rectangles. Genes are shown with the direction of transcription indicated by the arrowhead and exons indicated by bars. B–D, FISH was performed using BACs as indicated with the corresponding fluorescent label on formalin-fixed paraffin-embedded tissue sections for B, split signal assay of ETV1 and ETV4, C, split signal assay of the 5′ fusion partners, and D, fusion of the 5′ partners and ETV1 or ETV4. Split signals are indicated by red and green arrows, and fused signals are indicated by yellow arrows. For all assays, at least 50 nuclei were evaluated.
Figure 6. Androgen-regulation of the FLJ35294 and CANT1 genomic locus and characterization of the DDX5:ETV4 fusion protein in prostate cancer
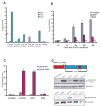
A, Expression of ERG (purple), ETV1 (green) and ETV4 (blue) was determined by Q-PCR in benign prostate and prostate cancer cases positive for either FLJ35294-ETV1, CANT1-ETV4, DDX5-ETV4 or SLC45A3:ERG. The expression levels of ERG, ETV1 and ETV4 exons were normalized to that of GAPDH and they are means of triplicate experiments. B, Androgen directly regulates FLJ35294 and CANT1 expression but not DDX5 expression. LNCaP cells were hormone-deprived for 48 hours, treated with R1881 or ethanol control, and assayed for FLJ35294, CANT1 and DDX5 transcript expression by Q-PCR. The effect of androgen was evaluated against a control sample at each corresponding time-point after treatment. The levels of FLJ35294, CANT1 and DDX5 were normalized to that of GAPDH (n = 3, mean ± SEM). C, Androgen receptor (AR) is physically recruited to the FLJ35294 and CANT1 genomic locus but not the DDX5 locus. AR enrichment values at the respective loci were assessed by chromatin immunoprecipitation (ChIP) analysis. ChIP was performed using an anti-AR antibody. ChIP-enrichment was determined as the percentage of input DNA (n = 3, mean ± SEM). A 3′ exon region of KIAA0066 was used as a negative control. D, Characterization of the DDX5-ETV4 fusion protein in prostate cancer. Upper panel, a schematic diagram of the DDX5-ETV4 fusion protein indicated by amino acids 1 to 102 of DDX5 fused to amino acids 65 to 484 of ETV4. A partial Q motif of DDX5 is retained in the fusion protein along with the ETS domain of ETV4 as indicated. Middle panel, detection of FLAG-tagged DDX5-ETV4 fusion protein by immunoblot analysis of HEK 293 cells transiently transfected with pCDNA3.2-DDX5-ETV4 expression construct. The cDNA was cloned from the patient specimen that harbored the DDX5:ETV4 fusion. Lower panel, detection of endogenous DDX5-ETV4 fusion protein (57 kDa) in a tissue lysate derived from the patient harboring the DDX5-ETV4 gene fusion (PCa_85). A lower band of 54 kDa was seen in all of the prostate lysates and may presumably represent endogenous ETV4 (not shown). GAPDH is used as the loading control.
Similar articles
- Novel 5' fusion partners of ETV1 and ETV4 in prostate cancer.
Barros-Silva JD, Paulo P, Bakken AC, Cerveira N, Løvf M, Henrique R, Jerónimo C, Lothe RA, Skotheim RI, Teixeira MR. Barros-Silva JD, et al. Neoplasia. 2013 Jul;15(7):720-6. doi: 10.1593/neo.13232. Neoplasia. 2013. PMID: 23814484 Free PMC article. - Distinct classes of chromosomal rearrangements create oncogenic ETS gene fusions in prostate cancer.
Tomlins SA, Laxman B, Dhanasekaran SM, Helgeson BE, Cao X, Morris DS, Menon A, Jing X, Cao Q, Han B, Yu J, Wang L, Montie JE, Rubin MA, Pienta KJ, Roulston D, Shah RB, Varambally S, Mehra R, Chinnaiyan AM. Tomlins SA, et al. Nature. 2007 Aug 2;448(7153):595-9. doi: 10.1038/nature06024. Nature. 2007. PMID: 17671502 - Novel RNA hybridization method for the in situ detection of ETV1, ETV4, and ETV5 gene fusions in prostate cancer.
Kunju LP, Carskadon S, Siddiqui J, Tomlins SA, Chinnaiyan AM, Palanisamy N. Kunju LP, et al. Appl Immunohistochem Mol Morphol. 2014 Sep;22(8):e32-40. doi: 10.1097/PAI.0000000000000095. Appl Immunohistochem Mol Morphol. 2014. PMID: 25203299 Free PMC article. - ETS gene fusions in prostate cancer.
Clark JP, Cooper CS. Clark JP, et al. Nat Rev Urol. 2009 Aug;6(8):429-39. doi: 10.1038/nrurol.2009.127. Nat Rev Urol. 2009. PMID: 19657377 Review. - ETS factors in prostate cancer.
Qian C, Li D, Chen Y. Qian C, et al. Cancer Lett. 2022 Apr 1;530:181-189. doi: 10.1016/j.canlet.2022.01.009. Epub 2022 Jan 14. Cancer Lett. 2022. PMID: 35033589 Free PMC article. Review.
Cited by
- Systematic analysis reveals molecular characteristics of ERG-negative prostate cancer.
Xiao Q, Sun Y, Dobi A, Srivastava S, Wang W, Srivastava S, Ji Y, Hou J, Zhao GP, Li Y, Li H. Xiao Q, et al. Sci Rep. 2018 Aug 27;8(1):12868. doi: 10.1038/s41598-018-30325-9. Sci Rep. 2018. PMID: 30150711 Free PMC article. - TMPRSS2:ERG gene fusion predicts subsequent detection of prostate cancer in patients with high-grade prostatic intraepithelial neoplasia.
Park K, Dalton JT, Narayanan R, Barbieri CE, Hancock ML, Bostwick DG, Steiner MS, Rubin MA. Park K, et al. J Clin Oncol. 2014 Jan 20;32(3):206-11. doi: 10.1200/JCO.2013.49.8386. Epub 2013 Dec 2. J Clin Oncol. 2014. PMID: 24297949 Free PMC article. Clinical Trial. - SLC45A3-ELK4 is a novel and frequent erythroblast transformation-specific fusion transcript in prostate cancer.
Rickman DS, Pflueger D, Moss B, VanDoren VE, Chen CX, de la Taille A, Kuefer R, Tewari AK, Setlur SR, Demichelis F, Rubin MA. Rickman DS, et al. Cancer Res. 2009 Apr 1;69(7):2734-8. doi: 10.1158/0008-5472.CAN-08-4926. Epub 2009 Mar 17. Cancer Res. 2009. PMID: 19293179 Free PMC article. - Role of the DEAD-box RNA helicase DDX5 (p68) in cancer DNA repair, immune suppression, cancer metabolic control, virus infection promotion, and human microbiome (microbiota) negative influence.
Li F, Ling X, Chakraborty S, Fountzilas C, Wang J, Jamroze A, Liu X, Kalinski P, Tang DG. Li F, et al. J Exp Clin Cancer Res. 2023 Aug 19;42(1):213. doi: 10.1186/s13046-023-02787-x. J Exp Clin Cancer Res. 2023. PMID: 37596619 Free PMC article. Review. - Rearrangements of the RAF kinase pathway in prostate cancer, gastric cancer and melanoma.
Palanisamy N, Ateeq B, Kalyana-Sundaram S, Pflueger D, Ramnarayanan K, Shankar S, Han B, Cao Q, Cao X, Suleman K, Kumar-Sinha C, Dhanasekaran SM, Chen YB, Esgueva R, Banerjee S, LaFargue CJ, Siddiqui J, Demichelis F, Moeller P, Bismar TA, Kuefer R, Fullen DR, Johnson TM, Greenson JK, Giordano TJ, Tan P, Tomlins SA, Varambally S, Rubin MA, Maher CA, Chinnaiyan AM. Palanisamy N, et al. Nat Med. 2010 Jul;16(7):793-8. doi: 10.1038/nm.2166. Epub 2010 Jun 6. Nat Med. 2010. PMID: 20526349 Free PMC article.
References
- Oikawa T, Yamada T. Molecular biology of the Ets family of transcription factors. Gene. 2003;303:11–34. - PubMed
- Seth A, Watson DK. ETS transcription factors and their emerging roles in human cancer. Eur J Cancer. 2005;41(16):2462–78. - PubMed
- Tognon C, Knezevich SR, Huntsman D, et al. Expression of the ETV6-NTRK3 gene fusion as a primary event in human secretory breast carcinoma. Cancer Cell. 2002;2(5):367–76. - PubMed
Publication types
MeSH terms
Substances
Grants and funding
- HHMI/Howard Hughes Medical Institute/United States
- R01 CA102872/CA/NCI NIH HHS/United States
- P50CA69568/CA/NCI NIH HHS/United States
- P50 CA069568/CA/NCI NIH HHS/United States
- U01 CA111275/CA/NCI NIH HHS/United States
- R01 CA097063/CA/NCI NIH HHS/United States
LinkOut - more resources
Full Text Sources
Other Literature Sources
Medical
Miscellaneous
