A C. elegans genome-scale microRNA network contains composite feedback motifs with high flux capacity - PubMed (original) (raw)
A C. elegans genome-scale microRNA network contains composite feedback motifs with high flux capacity
Natalia J Martinez et al. Genes Dev. 2008.
Abstract
MicroRNAs (miRNAs) and transcription factors (TFs) are primary metazoan gene regulators. Whereas much attention has focused on finding the targets of both miRNAs and TFs, the transcriptional networks that regulate miRNA expression remain largely unexplored. Here, we present the first genome-scale Caenorhabditis elegans miRNA regulatory network that contains experimentally mapped transcriptional TF --> miRNA interactions, as well as computationally predicted post-transcriptional miRNA --> TF interactions. We find that this integrated miRNA network contains 23 miRNA <--> TF composite feedback loops in which a TF that controls a miRNA is itself regulated by that same miRNA. By rigorous network randomizations, we show that such loops occur more frequently than expected by chance and, hence, constitute a genuine network motif. Interestingly, miRNAs and TFs in such loops are heavily regulated and regulate many targets. This "high flux capacity" suggests that loops provide a mechanism of high information flow for the coordinate and adaptable control of miRNA and TF target regulons.
Figures
Figure 1.
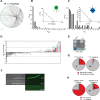
A genome-scale C. elegans TF → miRNA transcription regulatory network. (A) TF → miRNA interactions identified by high-throughput Y1H assays were visualized into a transcription regulatory network using Cytoscape (Shannon et al. 2003). (Blue diamonds) miRNA promoters; (green circles) TFs. (B) Out-degree; P(kout) is the proportion of miRNA promoters per TF. (Inset) The out-degree distribution best fits a power law (R2 = 0.82). (C) In-degree; P(kin) is the proportion of TFs per miRNA promoter. (Inset) The in-degree best fits an exponential distribution (R2 = 0.84). (D) TaqMan PCR assays of 48 miRNAs in N2 and daf-3(mgDf90) mutant dauer larvae. The average log2(fold change) of five experiments is shown. Error bars indicate standard error of the mean. Asterisks indicate significant changes. (1) mir-85. (2) mir-48. (3) mir-788. (4) mir-241. (Red bars) miRNAs bound by DAF-3 in Y1H assays; (blue bar) mir-788. The dashed line indicates a twofold difference. (E) Y1H assay confirming the interaction between DAF-3 and Pmir-788. (P) Permissive media; (S) selective media; (B) β-galactosidase assay; (AD) empty vector. (F) mir-788 is repressed in dauer larvae. (Left) Nomarski image. (Right) GFP fluorescence. The top right and right middle panels are 65-msec exposures, whereas the bottom right panel is a 230-msec exposure of the same field as in the right middle panel to visualize the presence of the animal. (G,H) Correlation between Y1H and TaqMan PCR data. Both the proportion and the actual numbers are depicted.
Figure 2.
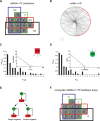
A C. elegans miRNA → TF post-transcription regulatory network. (A) Four-way Venn diagram showing the number of miRNA → TF predictions for TFs found in the transcriptional network. (Blue) RNA–hybrid; (green) Pictar; (red) miRanda; (black) TargetScanS; (gray) predictions common in two or more algorithms. (B) The predicted miRNA → TF post-transcription regulatory network. (Red squares) miRNAs; (green circles) TFs. (C) Out-degree; P(kout) is the proportion of TF targets per miRNA. (Inset) The out-degree best fits an exponential distribution (R2 = 0.90). (D) In-degree; P(kin) is the proportion of miRNA targeting a TF. (Inset) The in-degree best fits an exponential distribution (_R_2 = 0.84). (E, top) Cartoon of the two types of composite miRNA ↔ TF feedback loops: single negative (bottom left) and double negative (bottom right). A line with a dot indicates physical interaction; the blunt arrow indicates repression. (F) Four-way Venn diagram showing the number of composite miRNA ↔ TF feedback loops obtained after network integration. (Gray) Loops common in two or more algorithms.
Figure 3.
The mir-43 ↔ LIN-26 composite feedback loop. (A) LIN-26 and mir-43 function in a single-negative composite feedback loop. (B) TaqMan PCR analysis shows that mir-43 and the two miRNAs with which it is transcribed from an operon (mir-42 and mir-44) are down-regulated in lin-26(ok939) mutants compared with wild-type animals. The average log2(fold change) of three experiments with standard error of the mean is shown. The dashed lines indicate a twofold difference. Asterisks indicate significant changes. (C) Western blotting shows that LIN-26 is up-regulated in mir-42-44(nDf49) mutant embryos compared with N2 wild-type embryos. α-Tubulin antibody was used as a loading control. Numerical values represent LIN-26 levels after normalization to tubulin. (D) Pmir-42-44 drives expression in the developing embryo. (E) Pmir-42-44 drives expression in seam cells (a subset of seam cells is indicated by white arrows) in C. elegans larvae.
Figure 4.
(A) Example of a higher-order network subgraph containing multiple composite miRNA ↔ TF feedback loops. Black arrows indicate transcriptional interactions; dashed red arrows indicate post-transcriptional interactions. Red rectangles indicate miRNAs, and green circles indicate TFs. Repressive interactions are indicated by blunt arrows, and interactions for which the functional consequence is unknown are indicated by dotted arrows. (B) Y1H assay demonstrating the interaction between Pmir-795 and DAF-3. (P) Permissive media; (S) selective media; (B) β-galactosidase assay; (AD) empty vector.
Figure 5.
TFs and miRNAs in composite feedback loops are characterized by a high flux capacity (Fc). (A) Average in-degree and out-degree of miRNAs that participate in loops (red) or that do not (black). (B) Average in-degree and out-degree of TFs that participate in loops (green) or that do not (black). (C) The Fc of a node is defined by the product of the in- and out-degree. As the example indicates, nodes with the same total number of edges can have a different flux. (D,E) Plot of in-degree (kin) versus out-degree (kout) for each miRNA (D) and TF (E) in the integrated network. Red squares indicate miRNAs involved in composite feedback loops; green squares indicate TFs involved in feedback loops; black circles indicate miRNAs (D) and TFs (E) not involved in composite feedback loops. Dashed lines represent cut-offs for kin, kout, and Fc for the 15% most highly connected nodes.
Figure 6.
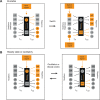
Model for the function of composite feedback loops in gene expression programs. (A) Bistable systems are generated by double-negative feedback loops. (B) Steady state or oscillatory systems can be generated by single-negative feedback loops. For each type of loop an example is shown in which orange indicates nodes or edges that are “on,” and gray indicates nodes or edges that are “off.”
Similar articles
- Inter- and intra-combinatorial regulation by transcription factors and microRNAs.
Zhou Y, Ferguson J, Chang JT, Kluger Y. Zhou Y, et al. BMC Genomics. 2007 Oct 30;8:396. doi: 10.1186/1471-2164-8-396. BMC Genomics. 2007. PMID: 17971223 Free PMC article. - Genome-scale spatiotemporal analysis of Caenorhabditis elegans microRNA promoter activity.
Martinez NJ, Ow MC, Reece-Hoyes JS, Barrasa MI, Ambros VR, Walhout AJ. Martinez NJ, et al. Genome Res. 2008 Dec;18(12):2005-15. doi: 10.1101/gr.083055.108. Epub 2008 Nov 3. Genome Res. 2008. PMID: 18981266 Free PMC article. - A novel framework for inferring condition-specific TF and miRNA co-regulation of protein-protein interactions.
Zhang J, Le TD, Liu L, He J, Li J. Zhang J, et al. Gene. 2016 Feb 10;577(1):55-64. doi: 10.1016/j.gene.2015.11.023. Epub 2015 Nov 27. Gene. 2016. PMID: 26611531 - Transcriptional control of microRNA expression in C. elegans: promoting better understanding.
Turner MJ, Slack FJ. Turner MJ, et al. RNA Biol. 2009 Jan-Mar;6(1):49-53. doi: 10.4161/rna.6.1.7574. Epub 2009 Jan 9. RNA Biol. 2009. PMID: 19106630 Free PMC article. Review. - Transcription factor and microRNA co-regulatory loops: important regulatory motifs in biological processes and diseases.
Zhang HM, Kuang S, Xiong X, Gao T, Liu C, Guo AY. Zhang HM, et al. Brief Bioinform. 2015 Jan;16(1):45-58. doi: 10.1093/bib/bbt085. Epub 2013 Dec 4. Brief Bioinform. 2015. PMID: 24307685 Review.
Cited by
- MicroRNA biogenesis: regulating the regulators.
Finnegan EF, Pasquinelli AE. Finnegan EF, et al. Crit Rev Biochem Mol Biol. 2013 Jan-Feb;48(1):51-68. doi: 10.3109/10409238.2012.738643. Epub 2012 Nov 19. Crit Rev Biochem Mol Biol. 2013. PMID: 23163351 Free PMC article. Review. - Using biological constraints to improve prediction in precision oncology.
Omar M, Dinalankara W, Mulder L, Coady T, Zanettini C, Imada EL, Younes L, Geman D, Marchionni L. Omar M, et al. iScience. 2023 Feb 2;26(3):106108. doi: 10.1016/j.isci.2023.106108. eCollection 2023 Mar 17. iScience. 2023. PMID: 36852282 Free PMC article. - The sequential action of miR156 and miR172 regulates developmental timing in Arabidopsis.
Wu G, Park MY, Conway SR, Wang JW, Weigel D, Poethig RS. Wu G, et al. Cell. 2009 Aug 21;138(4):750-9. doi: 10.1016/j.cell.2009.06.031. Cell. 2009. PMID: 19703400 Free PMC article. - A stele-enriched gene regulatory network in the Arabidopsis root.
Brady SM, Zhang L, Megraw M, Martinez NJ, Jiang E, Yi CS, Liu W, Zeng A, Taylor-Teeples M, Kim D, Ahnert S, Ohler U, Ware D, Walhout AJ, Benfey PN. Brady SM, et al. Mol Syst Biol. 2011 Jan 18;7:459. doi: 10.1038/msb.2010.114. Mol Syst Biol. 2011. PMID: 21245844 Free PMC article. - Enhanced yeast one-hybrid assays for high-throughput gene-centered regulatory network mapping.
Reece-Hoyes JS, Diallo A, Lajoie B, Kent A, Shrestha S, Kadreppa S, Pesyna C, Dekker J, Myers CL, Walhout AJ. Reece-Hoyes JS, et al. Nat Methods. 2011 Oct 30;8(12):1059-64. doi: 10.1038/nmeth.1748. Nat Methods. 2011. PMID: 22037705 Free PMC article.
References
- Alon U. Network motifs: Theory and experimental approaches. Nat. Rev. Genet. 2007;8:450–461. - PubMed
- Ambros V., Lee R.C., Lavanway A., Williams P.T., Jewell D. MicroRNAs and other tiny endogenous RNAs in C. elegans. Curr. Biol. 2003;13:807–818. - PubMed
- Bartel D.P. MicroRNAs: Genomics, biogenesis, mechanism, and function. Cell. 2004;116:281–297. - PubMed
- Bartel D.P., Chen C.Z. Micromanagers of gene expression: The potentially widespread influence of metazoan microRNAs. Nat. Rev. Genet. 2004;5:396–400. - PubMed
Publication types
MeSH terms
Substances
Grants and funding
- HL81341/HL/NHLBI NIH HHS/United States
- R01 DK068429/DK/NIDDK NIH HHS/United States
- P50 HG004233/HG/NHGRI NIH HHS/United States
- U01 HL081341/HL/NHLBI NIH HHS/United States
- DK068429/DK/NIDDK NIH HHS/United States
- F32 GM070118/GM/NIGMS NIH HHS/United States
- HG0017115/HG/NHGRI NIH HHS/United States
- HG004233/HG/NHGRI NIH HHS/United States
- GM070118-02/GM/NIGMS NIH HHS/United States
- HG003224/HG/NHGRI NIH HHS/United States
- GM348642/GM/NIGMS NIH HHS/United States
- R01 HG003224/HG/NHGRI NIH HHS/United States
LinkOut - more resources
Full Text Sources
Miscellaneous


