Identification of genetic variants using bar-coded multiplexed sequencing - PubMed (original) (raw)
doi: 10.1038/nmeth.1251. Epub 2008 Sep 14.
John V Pearson, Szabolcs Szelinger, Aswin Sekar, Margot Redman, Jason J Corneveaux, Traci L Pawlowski, Trisha Laub, Gary Nunn, Dietrich A Stephan, Nils Homer, Matthew J Huentelman
Affiliations
- PMID: 18794863
- PMCID: PMC3171277
- DOI: 10.1038/nmeth.1251
Identification of genetic variants using bar-coded multiplexed sequencing
David W Craig et al. Nat Methods. 2008 Oct.
Abstract
We developed a generalized framework for multiplexed resequencing of targeted human genome regions on the Illumina Genome Analyzer using degenerate indexed DNA bar codes ligated to fragmented DNA before sequencing. Using this method, we simultaneously sequenced the DNA of multiple HapMap individuals at several Encyclopedia of DNA Elements (ENCODE) regions. We then evaluated the use of Bayes factors for discovering and genotyping polymorphisms. For polymorphisms that were either previously identified within the Single Nucleotide Polymorphism database (dbSNP) or visually evident upon re-inspection of archived ENCODE traces, we observed a false positive rate of 11.3% using strict thresholds for predicting variants and 69.6% for lax thresholds. Conversely, false negative rates were 10.8-90.8%, with false negatives at stricter cut-offs occurring at lower coverage (<10 aligned reads). These results suggest that >90% of genetic variants are discoverable using multiplexed sequencing provided sufficient coverage at the polymorphic base.
Figures
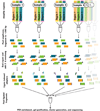
Figure 1
Schematic describing the preparation of indexed libraries. The red box indicates the indexing step, where for each person a unique indexed adapter was ligated to the fragmented genomic DNA.
Figure 2. Comparison of index performance
Index variability in initial sequencing runs (Library A) used for evaluating index performance are shown (top graph). Percentages of reads aligning to the reference sequence are listed by index, without introduction of normalization methods. A total of 30 indexes were present in >0.05% of all aligned reads. Highlighted in the blue box are 19 indexes with less than 5 fold difference in index frequencies, used in subsequence studies. Indexes matching with 0 errors are in blue bars and indexes with 1 error are in magenta bars. The bottom graph shows the location of errors by base, for each index.
Figure 3. Relationship between mean and local coverage
Example coverage of 4 individuals sequenced within a single line of an 8-lane flow-cell for 10 pooled amplicons as part of Library A. Amplicons are shown consecutively for each individual by the alternating shaded background. Index sequence and mean coverage for that individual are shown above each graph. The maximum and minimum coverage is shown for each amplicon in the top of the graph. Overlaying pie charts show the observed distribution of bases across all amplicons and the expected distribution determined from a Poisson distribution of the mean coverage, binned by 0 reads, 1–4 reads, 5–9 reads, 10–19 reads, and >20 reads.
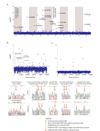
Figure 4. Discovery of variant bases by simultaneous analysis of all individuals
(a.) The Bayes-factor for polymorphism discovery(Ks) is plotted for each of the10 sequenced 5kb amplicons from Library A. Exact positions matching known polymorphisms are colored as red spheres and the dbSNP identifier is provided for the most significant SNPs. Black bars at top indicate locations of documented SNPs. A magnified view of amplicon 1 (b.) and amplicon 6 (c.) is provided to compare variants predicted by indexed-multiplexed sequencing to previous deep capillary sequencing results for the same individuals as part of the ENCODE project. (d–e.) Examples of false-positives arising from sequence homology to elsewhere in the genome. (f–i.) Examples of sequence traces validating the discovery of novel SNPs not previously annotated in ENCODE capillary sequencing traces. Similar analysis was conducted on Library B (shown in the supplementary figure 1).
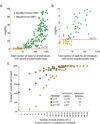
Figure 5. Relationship between base-level coverage and Bayes-factor for polymorphism discovery and variant genotyping
(a.) The y-axis is Log(Ks) and the x-axis is the total coverage across only those individuals with a non-reference genotype at a known polymorphism (AB or BB). (b.) Same, zoomed to lower Ks and lower coverage. (c.) The percent of the time the correct genotype was determined is plotted versus the coverage of the variant within the individual. Plots contain cumulative statistics using variant discovery and genotyping within both Library A and B.
Similar articles
- Bar-coded, multiplexed sequencing of targeted DNA regions using the Illumina Genome Analyzer.
Szelinger S, Kurdoglu A, Craig DW. Szelinger S, et al. Methods Mol Biol. 2011;700:89-104. doi: 10.1007/978-1-61737-954-3_7. Methods Mol Biol. 2011. PMID: 21204029 - Detection of genomic variation by selection of a 9 mb DNA region and high throughput sequencing.
Nikolaev SI, Iseli C, Sharp AJ, Robyr D, Rougemont J, Gehrig C, Farinelli L, Antonarakis SE. Nikolaev SI, et al. PLoS One. 2009 Aug 17;4(8):e6659. doi: 10.1371/journal.pone.0006659. PLoS One. 2009. PMID: 19684856 Free PMC article. - Multi-sample pooling and illumina genome analyzer sequencing methods to determine gene sequence variation for database development.
Margraf RL, Durtschi JD, Dames S, Pattison DC, Stephens JE, Mao R, Voelkerding KV. Margraf RL, et al. J Biomol Tech. 2010 Sep;21(3):126-40. J Biomol Tech. 2010. PMID: 20808642 Free PMC article. - TIA: algorithms for development of identity-linked SNP islands for analysis by massively parallel DNA sequencing.
Farris MH, Scott AR, Texter PA, Bartlett M, Coleman P, Masters D. Farris MH, et al. BMC Bioinformatics. 2018 Apr 11;19(1):126. doi: 10.1186/s12859-018-2133-2. BMC Bioinformatics. 2018. PMID: 29642839 Free PMC article. - Whole-genome resequencing of 100 healthy individuals using DNA pooling.
Wang X, Sui W, Wu W, Hou X, Ou M, Xiang Y, Dai Y. Wang X, et al. Exp Ther Med. 2016 Nov;12(5):3143-3150. doi: 10.3892/etm.2016.3797. Epub 2016 Oct 11. Exp Ther Med. 2016. PMID: 27882129 Free PMC article.
Cited by
- An ultra-dense linkage map identified quantitative trait loci corresponding to fruit quality- and size-related traits in red goji berry.
Rehman F, Gong H, Ma Y, Zeng S, Ke D, Yang C, Zhao Y, Wang Y. Rehman F, et al. Front Plant Sci. 2024 Sep 4;15:1390936. doi: 10.3389/fpls.2024.1390936. eCollection 2024. Front Plant Sci. 2024. PMID: 39297015 Free PMC article. - BaM-seq and TBaM-seq, highly multiplexed and targeted RNA-seq protocols for rapid, low-cost library generation from bacterial samples.
Johnson GE, Parker DJ, Lalanne JB, Parker ML, Li GW. Johnson GE, et al. NAR Genom Bioinform. 2023 Mar 3;5(1):lqad017. doi: 10.1093/nargab/lqad017. eCollection 2023 Mar. NAR Genom Bioinform. 2023. PMID: 36879903 Free PMC article. - Population admixtures in medaka inferred by multiple arbitrary amplicon sequencing.
Fujimoto S, Yaguchi H, Myosho T, Aoyama H, Sato Y, Kimura R. Fujimoto S, et al. Sci Rep. 2022 Nov 21;12(1):19989. doi: 10.1038/s41598-022-24498-7. Sci Rep. 2022. PMID: 36411327 Free PMC article. - Genotyping by Sequencing Advancements in Barley.
Rajendran NR, Qureshi N, Pourkheirandish M. Rajendran NR, et al. Front Plant Sci. 2022 Aug 8;13:931423. doi: 10.3389/fpls.2022.931423. eCollection 2022. Front Plant Sci. 2022. PMID: 36003814 Free PMC article. Review. - Genotyping-by-sequencing and genomic selection applications in hexaploid triticale.
Ayalew H, Anderson JD, Krom N, Tang Y, Butler TJ, Rawat N, Tiwari V, Ma XF. Ayalew H, et al. G3 (Bethesda). 2022 Feb 4;12(2):jkab413. doi: 10.1093/g3journal/jkab413. G3 (Bethesda). 2022. PMID: 34897452 Free PMC article.
References
Publication types
MeSH terms
LinkOut - more resources
Full Text Sources
Other Literature Sources
Miscellaneous


