Stimulated emission depletion (STED) nanoscopy of a fluorescent protein-labeled organelle inside a living cell - PubMed (original) (raw)
Stimulated emission depletion (STED) nanoscopy of a fluorescent protein-labeled organelle inside a living cell
Birka Hein et al. Proc Natl Acad Sci U S A. 2008.
Abstract
We demonstrate far-field optical imaging with subdiffraction resolution of the endoplasmic reticulum (ER) in the interior of a living mammalian cell. The diffraction barrier is overcome by applying stimulated emission depletion (STED) on a yellow fluorescent protein tag. Imaging individual structural elements of the ER revealed a focal plane (x, y) resolution of <50 nm inside the living cell, corresponding to a 4-fold improvement over that of a confocal microscope and a 16-fold reduction in the focal-spot cross-sectional area. A similar gain in resolution is realized with both pulsed- and continuous-wave laser illumination. Images of highly convoluted parts of the ER reveal a similar resolution improvement in 3D optical sectioning by a factor of 3 along the optic axis (z). Time-lapse STED recordings document morphological changes of the ER over time. Thus, nanoscale 3D imaging of organelles in the interior of living cells greatly expands the scope of light microscopy in cell biology.
Conflict of interest statement
The authors declare no conflict of interest.
Figures
Fig. 1.
Schematic showing the use of the excitation and deexcitation (STED) beams for 3D STED imaging inside a living cell. (A) An objective lens focuses the beams (blue, excitation; orange, STED) into the ER while also collecting the resulting beam of fluorescence photons. Images are acquired by translating the focused laser beams through the cell. (B) xy imaging: excitation spot (blue) and cylindrically shaped focal spot (orange) for stimulated emission, squeezing the fluorescent spot in the xy plane (STEDr or r-doughnut). Both the lateral (x, y) cross-sections in the focal plane and the axial cross-section (x, z) are shown (Upper and Lower, respectively). (C) xz imaging: excitation spot (blue) and STED spot composition consisting of a spot featuring a maximum above and below the focal plane along the z axis, referred to as STEDz, plus an enlarged r-doughnut STEDr. All spots represent data calculated by using the experimental conditions applied. (Scale bars, 500 nm.)
Fig. 2.
Subdiffraction-resolution imaging of the ER in a living mammalian cell. Shown are confocal (A) and simultaneously recorded (B) STED (x, y) images from the ER marked by the fluorescent protein Citrine targeted to the ER (raw data: 16.3-mW STED focal intensity). (Scale bar, 1 μm.) The arrows point out rings formed by the tubular network of the ER, which are visible only in the STED image. (C) Confocal and corresponding STED image revealing features of 52-nm FWHM as indicated by the profile below (raw data: 35.7-mW STED focal intensity), indicating that the lateral resolution in the STED image is <50 nm. (Scale bar, 500 nm.) (D) FWHM of the calculated effective STED point-spread function (PSF) and of the measured profile of an ER tubule versus the inverse of the square root of the STED beam intensity I (see Eq. 1). The measured FWHM values are based on 125 line profiles measured per individual value I in 5 different images; the error bars represent the quadratic mean of the respective SDs. For lower STED intensities I, the measured size of the ER elements decreases with the sharpening of the PSF, as expected from the square-root law, whereas for FWHM of ≈60 nm, no further decrease in the FWHM is observed, implying that the ER elements are, on average, ≈60 nm in width. (E) Confocal and corresponding STED image recorded with CW laser beams of 3 μW for excitation and 112 mW for STED (592-nm wavelength) at the sample, revealing tubules as small as 60 nm by STED. (Scale bar, 500 nm.)
Fig. 3.
Axial superresolution and improvement of optical sectioning inside a living cell using STED. An axial STED image (xz) of densely packed ER tubules (A) imaged by STED microscopy reveals single, stacked (oval) tubules, whereas in the confocal image (B), the same substructure is not revealed. The average focal power of the pulsed beams was 3 μW for excitation and 14.7 mW for the r-doughnut and 12.7 mW for the z-doughnut. (Scale bar, 500 nm.) (C) Line profile along the z direction (sum of four lines) of a single ER tubule at the marked position of the STED (A) and the confocal (B) images, respectively, revealing an axial FWHM of 450 nm in the confocal reference and 150 nm in the STED image. (D) Intensity profile along the z axis (sum of four z profiles) demonstrates the ability of the STED microscope to discern features that cannot be separated in the confocal reference.
Fig. 4.
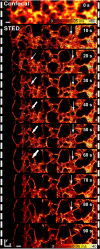
Dynamics of the ER imaged with subdiffraction resolution by STED (see also
Movie S1
). The images (10-s recording time each) were recorded consecutively, showing the movement of the ER with a resolution of ≈50 nm. The first image (time point 0 s) is a confocal reference image. The arrows indicate structural changes during the recording of the movie. (Scale bar, 500 nm.)
Fig. 5.
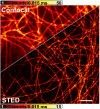
Subdiffraction resolution fluorescence imaging of Citrine-labeled microtubules inside a living PtK2 cell. In both the confocal reference and the STED counterpart, excitation was performed in the pulsed mode with 7.6 μW of time-averaged focal power. In the STED mode, a STED beam of 31-mW average power was added, which improves the lateral resolution inside the living cell from 180 to 60 nm. The resolution improvement is purely physical in nature (i.e., obtained without mathematical processing of recorded data); this attribute holds for all of the data shown in the article. (Scale bar, 2 μm.)
Similar articles
- STED microscopy with continuous wave beams.
Willig KI, Harke B, Medda R, Hell SW. Willig KI, et al. Nat Methods. 2007 Nov;4(11):915-8. doi: 10.1038/nmeth1108. Epub 2007 Oct 21. Nat Methods. 2007. PMID: 17952088 - Far-field optical nanoscopy based on continuous wave laser stimulated emission depletion.
Kuang C, Zhao W, Wang G. Kuang C, et al. Rev Sci Instrum. 2010 May;81(5):053709. doi: 10.1063/1.3432001. Rev Sci Instrum. 2010. PMID: 20515147 - Stimulated emission depletion (STED) imaging of dendritic spines in living hippocampal slices.
Willig KI, Nägerl UV. Willig KI, et al. Cold Spring Harb Protoc. 2012 May 1;2012(5):pdb.prot069260. doi: 10.1101/pdb.prot069260. Cold Spring Harb Protoc. 2012. PMID: 22550296 - Nanoscale resolution in GFP-based microscopy.
Willig KI, Kellner RR, Medda R, Hein B, Jakobs S, Hell SW. Willig KI, et al. Nat Methods. 2006 Sep;3(9):721-3. doi: 10.1038/nmeth922. Nat Methods. 2006. PMID: 16896340 Review. - STED microscopy for nanoscale imaging in living brain slices.
Chéreau R, Tønnesen J, Nägerl UV. Chéreau R, et al. Methods. 2015 Oct 15;88:57-66. doi: 10.1016/j.ymeth.2015.06.006. Epub 2015 Jun 9. Methods. 2015. PMID: 26070997 Review.
Cited by
- Single cell optical imaging and spectroscopy.
Stender AS, Marchuk K, Liu C, Sander S, Meyer MW, Smith EA, Neupane B, Wang G, Li J, Cheng JX, Huang B, Fang N. Stender AS, et al. Chem Rev. 2013 Apr 10;113(4):2469-527. doi: 10.1021/cr300336e. Epub 2013 Feb 14. Chem Rev. 2013. PMID: 23410134 Free PMC article. Review. No abstract available. - Axial localization and tracking of self-interference nanoparticles by lateral point spread functions.
Liu Y, Zhou Z, Wang F, Kewes G, Wen S, Burger S, Ebrahimi Wakiani M, Xi P, Yang J, Yang X, Benson O, Jin D. Liu Y, et al. Nat Commun. 2021 Apr 1;12(1):2019. doi: 10.1038/s41467-021-22283-0. Nat Commun. 2021. PMID: 33795675 Free PMC article. - Dual-color three-dimensional STED microscopy with a single high-repetition-rate laser.
Han KY, Ha T. Han KY, et al. Opt Lett. 2015 Jun 1;40(11):2653-6. doi: 10.1364/OL.40.002653. Opt Lett. 2015. PMID: 26030581 Free PMC article. - Reticulon and CLIMP-63 regulate nanodomain organization of peripheral ER tubules.
Gao G, Zhu C, Liu E, Nabi IR. Gao G, et al. PLoS Biol. 2019 Aug 30;17(8):e3000355. doi: 10.1371/journal.pbio.3000355. eCollection 2019 Aug. PLoS Biol. 2019. PMID: 31469817 Free PMC article. - Feature Extraction of 3T3 Fibroblast Microtubule Based on Discrete Wavelet Transform and Lucy-Richardson Deconvolution Methods.
Bai H, Che B, Zhao T, Zhao W, Wang K, Zhang C, Bai J. Bai H, et al. Micromachines (Basel). 2022 May 25;13(6):824. doi: 10.3390/mi13060824. Micromachines (Basel). 2022. PMID: 35744438 Free PMC article.
References
- Tsien RY. The green fluorescent protein. Annu Rev Biochem. 1998;67:509–544. - PubMed
- Pawley JB, editor. Handbook of Biological Confocal Microscopy. New York: Springer; 2006.
- Abbe E. Contributions to the theory of the microscope and the microscopical perception (Translated from German) Arch Mikr Anat. 1873;9:413–468.
- Hell SW, Wichmann J. Breaking the diffraction resolution limit by stimulated emission: Stimulated emission depletion microscopy. Opt Lett. 1994;19:780–782. - PubMed
Publication types
MeSH terms
Substances
LinkOut - more resources
Full Text Sources
Other Literature Sources


