A genome-wide RNAi screen to dissect centriole duplication and centrosome maturation in Drosophila - PubMed (original) (raw)
A genome-wide RNAi screen to dissect centriole duplication and centrosome maturation in Drosophila
Jeroen Dobbelaere et al. PLoS Biol. 2008.
Abstract
Centrosomes comprise a pair of centrioles surrounded by an amorphous pericentriolar material (PCM). Here, we have performed a microscopy-based genome-wide RNA interference (RNAi) screen in Drosophila cells to identify proteins required for centriole duplication and mitotic PCM recruitment. We analysed 92% of the Drosophila genome (13,059 genes) and identified 32 genes involved in centrosome function. An extensive series of secondary screens classified these genes into four categories: (1) nine are required for centriole duplication, (2) 11 are required for centrosome maturation, (3) nine are required for both functions, and (4) three genes regulate centrosome separation. These 32 hits include several new centrosomal components, some of which have human homologs. In addition, we find that the individual depletion of only two proteins, Polo and Centrosomin (Cnn) can completely block centrosome maturation. Cnn is phosphorylated during mitosis in a Polo-dependent manner, suggesting that the Polo-dependent phosphorylation of Cnn initiates centrosome maturation in flies.
Conflict of interest statement
Competing interests. The authors have declared that no competing interests exist.
Figures
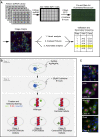
Figure 1. A Genome-Wide RNAi Screen for Centrosome Defects
(A) A summary of the genome-wide RNAi screen. A dsRNA library was dispensed in 384-well plates suitable for high-throughput microscopy to a final concentration of 0.22 μg of dsRNA per well. Approximately 10.5 × 10³ S2R+ cells were aliquoted to each well and incubated for 4 d. Eight hours prior to fixation and cell staining, 25 μM colchicine was added to arrest cells in mitosis. Plates were manually analysed on a microscope, and pictures were then automatically acquired from four fields per well. Pictures were analysed manually and automatically using CellProfiler. Genes were selected for secondary screening if scored as “hits” with two of the three screening methods. (B) A schematic overview of the screening setup and expected phenotypes. The PCM is depicted in green, mitotic DNA in red, and DNA in blue. Centrioles, in grey, were not stained in the primary screen, but since the PCM is only nucleated around the centrioles [16], centriole duplication defects would be detected in this screen. (C) Examples of automated pictures from control-, polo-, Map205-, and Rcd4 (CG17295)-depleted wells. Scale bar represents 15 μm.
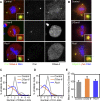
Figure 2. Genes Involved in Centriole Duplication (Class I)
(A) S2R+ cells treated with dsRNA against GFP (control), DSas-6, and Rcd1 (CG8233) were stained with Hoechst (DNA, blue), DSas-4 (a centriole marker, red), and Cnn (a PCM marker, green). Inset shows a 4× magnified view. (B) Recruitment of DSpd-2 (green) and γ-tubulin (red) after dsRNA treatment for Control, DSas-6, and Rcd1. DNA is shown in blue, and inset shows a 4× magnified view. (C and D) Analysis of centriole (C) and centrosome (D) numbers in mitotic cells after RNAi treatment. More than 30 mitotic cells were counted in two independent experiments. (E) Analysis of PCM size in mitotic cells after RNAi treatment. The graph represents the mean intensity of PCM staining (Cnn) from three independent experiments, each analysing more than 20 centrosomes. Error bars represent the SE. Note how the number of centrioles and centrosomes per cell is reduced (C and D), whereas the amount of PCM recruited to the remaining centrioles is not affected (E) after DSas-6 and Rcd1 depletion. Scale bar in (A and B) represents 5 μm.
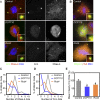
Figure 3. Genes Involved in Both Centriole Duplication and PCM Recruitment (Class II)
(A) S2R+ cells treated with dsRNA against GFP (control), DCP110, and Rcd4 (CG17295) were stained with Hoechst (DNA, blue), DSas-4 (a centriole marker, red), and Cnn (a PCM marker, green). Inset shows a 4× magnified view. (B) Recruitment of DSpd-2 (green) and γ-tubulin (red) after dsRNA treatment for control, DCP110, and Rcd4. DNA is shown in blue, and inset shows a 4× magnified view. (C and D) Analysis of centriole (C) and centrosome (D) numbers in mitotic cells after RNAi treatment. More than 30 mitotic cells were counted in three independent experiments. (E) Analysis of PCM size in mitotic cells after RNAi treatment. The graph represents the mean intensity of PCM staining (Cnn) from three independent experiments, each analysing more than 20 centrosomes. Error bars represent the SE; an asterisk (*) indicates p ≤ 0.05 compared to control. Note how the number of centrioles and centrosomes per cell is reduced (C and D), and the amount of PCM recruited to the remaining centrioles is also reduced (E) after DCP110 and Rcd4 depletion. Scale bar in (A and B) represents 5 μm.
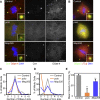
Figure 4. Genes Involved in PCM Recruitment (Class III)
(A) S2R+ cells treated with dsRNA against GFP (control), polo, and Map205 were stained with Hoechst (DNA, blue), DSas-4 (a centriole marker, red), and Cnn (a PCM marker, green). Inset shows a 4× magnified view. (B) Recruitment of DSpd-2 (green) and γ-tubulin (red) after dsRNA treatment for control, polo, and Map205. DNA is shown in blue, and inset shows a 4× magnified view. (C and D) Analysis of centriole (C) and centrosome (D) numbers in mitotic cells after RNAi treatment. More than 30 mitotic cells were counted in two independent experiments. (E) Analysis of PCM size in mitotic cells after RNAi treatment. The graph represents the mean intensity of PCM staining (Cnn) from three independent experiments, each analysing more than 20 centrosomes. Error bars represent the SE; a single asterisk (*) or double asterisks (**) indicate p ≤ 0.05 or p ≤ 0.01 compared to control, respectively. Note how the number of centrioles per cell is not dramatically perturbed (C), but the number centrosomes (D) and the amount of PCM recruited to the centrioles (E) is reduced after polo and Map205 depletion. Scale bar (A and B) represents 5 μm.
Figure 5. Genes Involved in Centrosome Separation (Class IV)
(A) S2R+ cells treated with dsRNA against GFP (control), Aurora A (aur), and UbcD6 were stained with Hoechst (DNA, blue), DSas-4 (a centriole marker, red), and Cnn (a PCM marker, green). Inset shows a 4× magnified view. (B) Recruitment of DSpd-2 (green) and γ-tubulin (red) after dsRNA treatment for control, Aurora A, and UbcD6. DNA is shown in blue, and inset shows a 4× magnified view. (C and D) Analysis of centriole (C) and centrosome (D) numbers in mitotic cells after RNAi treatment. More than 30 mitotic cells were counted in two independent experiments. (E) Analysis of PCM size in mitotic cells after RNAi treatment. The graph represents the mean intensity of PCM staining (Cnn) from three independent experiments, each analysing more than 20 centrosomes. The lighter bars labelled with a Δ represent the PCM recruitment to the subset of the centrosomes that contained only one centriole dot. Error bars represent the SE. An asterisk (*) marks p ≤ 0.05 compared to control. This analysis suggests that PCM recruitment is impaired in cells depleted of Aurora A and UbcD6, but this effect is masked by the clustering of multiple centrosomes together. Scale bar in (A and B) represents 5 μm.
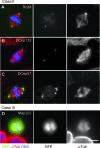
Figure 6. Localisation of Several Newly Identified Centrosome/Spindle Components by GFP-Tagging
S2 cells stably transfected with GFP-constructs expressing Rcd4 (CG17295) (A), DCep135 (B), DCep97 (C), or Map205 (D) under the control of the metallothionein promotor (pMT) were induced for 24 h, fixed with paraformaldehyde, and costained with Hoechst (DNA) and anti–α-tubulin antibodies. The merged picture shows the GFP-fusion protein in green, α-tubulin in red, and DNA in blue. Scale bar represents 5 μm.
Figure 7. Polo and Cnn Are Interdependent for Their Localisation and Function at Centrosomes
(A) Pictures from the primary screen of S2R+ cells treated with dsRNA against GFP (control), Cnn, and polo. The localisation of Cnn (green), Phospho-histone H3 (red), and DNA (blue) is shown. (B) S2R+ cells treated with RNAi against GFP, Cnn, and Polo were stained with antibodies against Cnn (green) and Polo (red), and counterstained with Hoechst (blue). (C) S2R+ cells treated with RNAi against GFP, Cnn, and polo were stained with antibodies against Cnn (green) and “active” Polo (red), and counterstained with Hoechst (blue). Note how the depletion of Cnn disrupts the centrosomal, but not the kinetochore, localisation of Polo, whereas the depletion of Polo disrupts the centrosomal localization of Cnn. Scale bar in (A) represents 15 μm, in (B and C), it represents 5 μm.
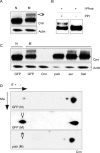
Figure 8. Cnn Is Phosphorylated in Mitosis in a Polo-Dependent Manner
(A) Western blot showing the phosphorylation of Cnn (indicated by the band shift in the 1D gel—arrow) in extracts from nontreated cycling S2R+ cells (N) and extracts enriched for mitotic cells by colchicine treatment (M). Actin was used as a loading control. (B) Extracts enriched for mitotic cells were treated with λ-phosphatase in the presence or absence of phosphatase inhibitors. (C) Western blot showing the behaviour of Cnn in extracts from nontreated cycling cells (N) and extracts enriched for mitotic cells by colchicine treatment (M) after treatment with dsRNA against control (GFP), Cnn, polo, Aurora A (aur), and Sak/Plk4 for 4 d. The depletion of only Polo blocks the formation of the phosphorylated form of Cnn. Note that the total protein loaded in the Polo depletion shown here is slightly reduced compared to the other lanes. The upper (phosphorylated) form of Cnn, however, was undetectable on much longer exposures of this blot, and we consistently failed to detect this upper band in several independent Polo-depletion experiments (unpublished data). Thus, we are very confident that the absence of this band from the Polo-depleted cells is not simply due to the lower amount of protein loaded in this lane. (D) Western blot analysis of a 2-D gel of nontreated cycling S2R+ cell extracts (N) or extracts enriched for mitotic cells by colchicine treatment (M) treated with a control dsRNA (GFP) or a dsRNA against Polo. The phosphorylated form of Cnn is enriched in control (GFP) mitotic extracts (arrowhead), but is not present in mitotic extracts from Polo-depleted cells (polo—arrow). Note that the depletion of Polo does not dramatically alter the proportion of cells in mitosis in any of these depleted cells treated with colchicine (∼20%–35% in all cases—as judged by phospho-histone H3 staining).
Similar articles
- The centrosome-specific phosphorylation of Cnn by Polo/Plk1 drives Cnn scaffold assembly and centrosome maturation.
Conduit PT, Feng Z, Richens JH, Baumbach J, Wainman A, Bakshi SD, Dobbelaere J, Johnson S, Lea SM, Raff JW. Conduit PT, et al. Dev Cell. 2014 Mar 31;28(6):659-69. doi: 10.1016/j.devcel.2014.02.013. Epub 2014 Mar 20. Dev Cell. 2014. PMID: 24656740 Free PMC article. - Plk1/Polo Phosphorylates Sas-4 at the Onset of Mitosis for an Efficient Recruitment of Pericentriolar Material to Centrosomes.
Ramani A, Mariappan A, Gottardo M, Mandad S, Urlaub H, Avidor-Reiss T, Riparbelli M, Callaini G, Debec A, Feederle R, Gopalakrishnan J. Ramani A, et al. Cell Rep. 2018 Dec 26;25(13):3618-3630.e6. doi: 10.1016/j.celrep.2018.11.102. Cell Rep. 2018. PMID: 30590037 - Structured illumination of the interface between centriole and peri-centriolar material.
Fu J, Glover DM. Fu J, et al. Open Biol. 2012 Aug;2(8):120104. doi: 10.1098/rsob.120104. Open Biol. 2012. PMID: 22977736 Free PMC article. - Role of Polo-like Kinases Plk1 and Plk4 in the Initiation of Centriole Duplication-Impact on Cancer.
Hoffmann I. Hoffmann I. Cells. 2022 Feb 24;11(5):786. doi: 10.3390/cells11050786. Cells. 2022. PMID: 35269408 Free PMC article. Review. - SAPs as a new model to probe the pathway of centriole and centrosome assembly.
Wainman A. Wainman A. Biochem Soc Trans. 2021 Jun 30;49(3):1233-1240. doi: 10.1042/BST20200833. Biochem Soc Trans. 2021. PMID: 33960367 Free PMC article. Review.
Cited by
- Probing the boundaries of orthology: the unanticipated rapid evolution of Drosophila centrosomin.
Eisman RC, Kaufman TC. Eisman RC, et al. Genetics. 2013 Aug;194(4):903-26. doi: 10.1534/genetics.113.152546. Epub 2013 Jun 7. Genetics. 2013. PMID: 23749319 Free PMC article. - Ultrastructural analysis of mitotic Drosophila S2 cells identifies distinctive microtubule and intracellular membrane behaviors.
Strunov A, Boldyreva LV, Andreyeva EN, Pavlova GA, Popova JV, Razuvaeva AV, Anders AF, Renda F, Pindyurin AV, Gatti M, Kiseleva E. Strunov A, et al. BMC Biol. 2018 Jun 15;16(1):68. doi: 10.1186/s12915-018-0528-1. BMC Biol. 2018. PMID: 29907103 Free PMC article. - A conserved role for centriolar satellites in translation of centrosomal and ciliary proteins.
Pachinger C, Dobbelaere J, Rumpf-Kienzl C, Raina S, Garcia-Baucells J, Sarantseva M, Brauneis A, Dammermann A. Pachinger C, et al. J Cell Biol. 2025 Aug 4;224(8):e202408042. doi: 10.1083/jcb.202408042. Epub 2025 May 21. J Cell Biol. 2025. PMID: 40396915 Free PMC article. - The centrosomin CM2 domain is a multi-functional binding domain with distinct cell cycle roles.
Citron YR, Fagerstrom CJ, Keszthelyi B, Huang B, Rusan NM, Kelly MJS, Agard DA. Citron YR, et al. PLoS One. 2018 Jan 9;13(1):e0190530. doi: 10.1371/journal.pone.0190530. eCollection 2018. PLoS One. 2018. PMID: 29315319 Free PMC article. - A modified TurboID approach identifies tissue-specific centriolar components in C. elegans.
Holzer E, Rumpf-Kienzl C, Falk S, Dammermann A. Holzer E, et al. PLoS Genet. 2022 Apr 20;18(4):e1010150. doi: 10.1371/journal.pgen.1010150. eCollection 2022 Apr. PLoS Genet. 2022. PMID: 35442950 Free PMC article.
References
- Kellogg DR, Moritz M, Alberts BM. The centrosome and cellular organization. Annu Rev Biochem. 1994;63:639–674. - PubMed
- Bornens M. Centrosome composition and microtubule anchoring mechanisms. Curr Opin Cell Biol. 2002;14:25–34. - PubMed
- Cowan CR, Hyman AA. Centrosomes direct cell polarity independently of microtubule assembly in C. elegans embryos. Nature. 2004;431:92–96. - PubMed
- Stevenson VA, Kramer J, Kuhn J, Theurkauf WE. Centrosomes and the Scrambled protein coordinate microtubule-independent actin reorganization. Nat Cell Biol. 2001;3:68–75. - PubMed
- Doxsey S, McCollum D, Theurkauf W. Centrosomes in cellular regulation. Annu Rev Cell Dev Biol. 2005;21:411–434. - PubMed
Publication types
MeSH terms
Substances
LinkOut - more resources
Full Text Sources
Molecular Biology Databases
