Evidence for a frontoparietal control system revealed by intrinsic functional connectivity - PubMed (original) (raw)
Evidence for a frontoparietal control system revealed by intrinsic functional connectivity
Justin L Vincent et al. J Neurophysiol. 2008 Dec.
Erratum in
- J Neurophysiol. 2011 Mar;105(3):1427
Abstract
Two functionally distinct, and potentially competing, brain networks have been recently identified that can be broadly distinguished by their contrasting roles in attention to the external world versus internally directed mentation involving long-term memory. At the core of these two networks are the dorsal attention system and the hippocampal-cortical memory system, a component of the brain's default network. Here spontaneous blood-oxygenation-level-dependent (BOLD) signal correlations were used in three separate functional magnetic resonance imaging data sets (n = 105) to define a third system, the frontoparietal control system, which is spatially interposed between these two previously defined systems. The frontoparietal control system includes many regions identified as supporting cognitive control and decision-making processes including lateral prefrontal cortex, anterior cingulate cortex, and inferior parietal lobule. Detailed analysis of frontal and parietal cortex, including use of high-resolution data, revealed clear evidence for contiguous but distinct regions: in general, the regions associated with the frontoparietal control system are situated between components of the dorsal attention and hippocampal-cortical memory systems. The frontoparietal control system is therefore anatomically positioned to integrate information from these two opposing brain systems.
Figures
FIG. 1.
Significant voxel-wise correlations in 10 humans associated with regions of interest in the right (A) and left (B) anterior prefrontal cortex (aPFC). Regions are shown in red to the left of the statistical maps. C: conjunction map showing regions consistently correlated with both aPFC regions.
FIG. 2.
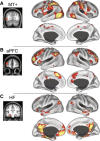
Significant spontaneous blood-oxygen-level-dependent (BOLD) correlations associated with seed regions in left middle temporal motion complex (MT+, A), aPFC (B), and the hippocampal formation (HF; C) in dataset 1 are displayed on the lateral and medial inflated surfaces of the left and right hemisphere. The seed regions used to compute the correlation maps are shown on coronal slices to the left of their associated functional correlation maps.
FIG. 3.
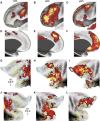
The anterior prefrontal cortex is functionally correlated with a lateral parietal region that is spatially interposed between functional correlations associated with the MT+ and the HF. Significant spontaneous BOLD correlations associated with seed regions in left MT+ (A, D, and G), aPFC (B, E, and H), and the HF (C, F, and I) in dataset 2 are displayed on the posterior-lateral inflated surface of the left hemisphere (A_–_C) and the flattened representation of the left (D_–_F) and right (G_–_I) hemispheres. Borders are drawn around the parietal correlations associated with each seed region. The colors magenta, yellow, and cyan correspond to MT+, aPFC, and HF parietal correlations, respectively. A directional compass and sulcal labels are provided for reference. G: medial (M), lateral (L), anterior (A), posterior (P), intraparietal sulcus (IPS), central sulcus (CS), sylvian fissure (SF).
FIG. 4.
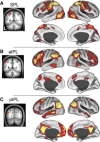
Significant spontaneous BOLD correlations associated with seed regions in left superior parietal lobule (SPL, A), anterior inferior parietal lobule (aIPL, B), and posterior inferior parietal lobule (pIPL, C) in dataset 3 are displayed on the lateral and medial inflated surfaces of the left and right hemispheres. The seed regions used to compute the correlation maps are shown on coronal slices to the left of their associated functional correlation maps.
FIG. 5.
The aIPL is functionally correlated with a many regions in frontal cortex that are roughly spatially interposed between functional correlations associated with the SPL and the pIPL. Significant spontaneous BOLD correlations associated with seed regions in left SPL (A, D, G, and J), aIPL (B, E, H, and K), and the pIPL (C, F, I, and L) in dataset 3 are displayed on the anterior-lateral inflated surface of the left hemisphere (A_–_C), the anterior-medial surface of the left hemisphere (D_–_F), and the flattened representation of the left (G_–_I) and right (J_–_L) hemispheres. Borders are drawn around the frontal and insular correlations associated with each seed region. The colors magenta, yellow, and cyan correspond to SPL, aIPL, and pIPL parietal correlations, respectively. A directional compass is provided for reference.
FIG. 6.
Convergence analyses illustrate the cortical topography of regions that correlate with left MT+ complex (A), aPFC (B), and the left HF (C) across the three independent data sets. Convergent correlations are overlaid on axial slices of an average MNI atlas space template. The correlation with seed regions were identified at a threshold of P < 0.05 (multiple comparison corrected) in each of the 3 independent data sets. Voxels over threshold in 2 of 3 data sets are shown in red; 3 of 3 data sets are shown in yellow. MT+ convergence is observed in premotor cortex and MT+ extending along the intraparietal and superior parietal cortex to postcentral gyrus. aPFC convergence is observed in the anterior and dorsolateral prefrontal cortex, anterior inferior parietal lobule, anterior cingulate, and anterior insula. HF convergence is observed in the posterior inferior parietal lobule, ventral medial prefrontal, lateral temporal, as well as along the medial surface extending from the retrosplenial cortex into posterior cingulate.
FIG. 7.
Intrinsically defined dorsal attention (DAS), frontoparietal control (FPCS), and hippocampal-cortical memory (HCMS) systems and the overlap between them from dataset 3. Voxels in the DAS include regions correlated with MT+ and SPL and are shown in blue. Voxels in the FPCS include regions correlated with aPFC and aIPL and are shown in light green. Voxels in the HCMS include regions correlated with HF and pIPL and are shown in orange. Voxels significantly correlated with the DAS and FPCS are shown in red. Voxels significantly correlated with the HCMS and FPCS are shown in dark green. Data are displayed on the lateral, medial, and dorsal surfaces of the left and right hemispheres as well as MNI atlas space axial and sagittal slices.
Similar articles
- Default network activity, coupled with the frontoparietal control network, supports goal-directed cognition.
Spreng RN, Stevens WD, Chamberlain JP, Gilmore AW, Schacter DL. Spreng RN, et al. Neuroimage. 2010 Oct 15;53(1):303-17. doi: 10.1016/j.neuroimage.2010.06.016. Epub 2010 Jun 18. Neuroimage. 2010. PMID: 20600998 Free PMC article. - Functional connectivity in a frontoparietal network involving the dorsal anterior cingulate cortex underlies decisions to accept a hypothesis.
Whitman JC, Metzak PD, Lavigne KM, Woodward TS. Whitman JC, et al. Neuropsychologia. 2013 May;51(6):1132-41. doi: 10.1016/j.neuropsychologia.2013.02.016. Epub 2013 Mar 7. Neuropsychologia. 2013. PMID: 23474076 - Anterior cingulate cortex differently modulates frontoparietal functional connectivity between resting-state and working memory tasks.
Di X, Zhang H, Biswal BB. Di X, et al. Hum Brain Mapp. 2020 May;41(7):1797-1805. doi: 10.1002/hbm.24912. Epub 2020 Jan 6. Hum Brain Mapp. 2020. PMID: 31904907 Free PMC article. - The role of the right temporoparietal junction in social interaction: how low-level computational processes contribute to meta-cognition.
Decety J, Lamm C. Decety J, et al. Neuroscientist. 2007 Dec;13(6):580-93. doi: 10.1177/1073858407304654. Epub 2007 Oct 2. Neuroscientist. 2007. PMID: 17911216 Review. - Brain connectivity and visual attention.
Parks EL, Madden DJ. Parks EL, et al. Brain Connect. 2013;3(4):317-38. doi: 10.1089/brain.2012.0139. Epub 2013 Jun 8. Brain Connect. 2013. PMID: 23597177 Free PMC article. Review.
Cited by
- Effects of scanner acoustic noise on intrinsic brain activity during auditory stimulation.
Yakunina N, Kang EK, Kim TS, Min JH, Kim SS, Nam EC. Yakunina N, et al. Neuroradiology. 2015 Oct;57(10):1063-73. doi: 10.1007/s00234-015-1561-1. Epub 2015 Jul 21. Neuroradiology. 2015. PMID: 26193957 - A Meta-analysis on the neural basis of planning: Activation likelihood estimation of functional brain imaging results in the Tower of London task.
Nitschke K, Köstering L, Finkel L, Weiller C, Kaller CP. Nitschke K, et al. Hum Brain Mapp. 2017 Jan;38(1):396-413. doi: 10.1002/hbm.23368. Epub 2016 Sep 15. Hum Brain Mapp. 2017. PMID: 27627877 Free PMC article. - Improved brain community structure detection by two-step weighted modularity maximization.
Guo Z, Zhao X, Yao L, Long Z. Guo Z, et al. PLoS One. 2023 Dec 8;18(12):e0295428. doi: 10.1371/journal.pone.0295428. eCollection 2023. PLoS One. 2023. PMID: 38064462 Free PMC article. - Mapping PTSD symptoms to brain networks: a machine learning study.
Zandvakili A, Barredo J, Swearingen HR, Aiken EM, Berlow YA, Greenberg BD, Carpenter LL, Philip NS. Zandvakili A, et al. Transl Psychiatry. 2020 Jun 18;10(1):195. doi: 10.1038/s41398-020-00879-2. Transl Psychiatry. 2020. PMID: 32555146 Free PMC article. - Mind-wandering as spontaneous thought: a dynamic framework.
Christoff K, Irving ZC, Fox KC, Spreng RN, Andrews-Hanna JR. Christoff K, et al. Nat Rev Neurosci. 2016 Nov;17(11):718-731. doi: 10.1038/nrn.2016.113. Epub 2016 Sep 22. Nat Rev Neurosci. 2016. PMID: 27654862 Review.
References
- Andersen RA, Buneo CA. Intentional maps in posterior parietal cortex. Annu Rev Neurosci 25: 189–220, 2002 - PubMed
- Andreasen NC, O'Leary DS, Cizadlo T, Arndt S, Rezai K, Watkins GL, Ponto LL, Hichwa RD. Remembering the past: two facets of episodic memory explored with positron emission tomography. Am J Psychiatry 152: 1576–1585, 1995 - PubMed
- Atkinson RC, Juola JF. Search and decision processes in recognition memory. In: Contemporary Developments in Mathematical Psychology, edited by Krantz DH, Atkinson RC, Luce RD, Suppes P. San Diego, CA: Freeman, 1974, vol. 1, p. 242–293.
- Badre D, D'Esposito M. Functional magnetic resonance imaging evidence for a hierarchical organization in the prefrontal cortex. J Cogn Neurosci 19: 2082–2099, 2007 - PubMed
- Balota DA, Chumbley JI. Are lexical decisions a good measure of lexical access? The role of word frequency in the neglected decision stage. J Exp Psychol Hum Percept Perform. 10: 340–357, 1984 - PubMed
Publication types
MeSH terms
Substances
LinkOut - more resources
Full Text Sources
Other Literature Sources


