Amplification of transducer gain by angiotensin II-mediated enhancement of cortical actin density in osmosensory neurons - PubMed (original) (raw)
Amplification of transducer gain by angiotensin II-mediated enhancement of cortical actin density in osmosensory neurons
Zizhen Zhang et al. J Neurosci. 2008.
Abstract
Osmosensory neurons transduce osmotic signals into a neural spike code that commands behavioral and endocrine responses that mediate body fluid homeostasis. Although changes in osmoregulatory reflex gain are known to occur under physiological and pathological conditions, the basis for this modulation is unknown. Here, we show that angiotensin II amplifies osmosensory transduction by enhancing the proportional relationship between osmolality, receptor potential, and action potential firing in rat supraoptic nucleus neurons. This effect is mediated by a phospholipase C- and protein kinase C-dependent increase in cellular mechanosensitivity that is associated with a rapid increase in cortical actin filament density. Preventing this increase with cytochalasin D eliminated the enhancement of mechanosensitivity, whereas enhancing actin filament density with jasplakinolide potentiated mechanosensitivity and occluded the effects of angiotensin II. These results indicate that a receptor-mediated increase in cortical actin density can enhance osmosensitivity in acutely isolated supraoptic neurons.
Figures
Figure 1.
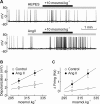
Ang II increases osmosensory gain in MNCs. A, Examples of voltage recordings obtained from isolated MNCs exposed to a +10 mosmol · kg−1 hyperosmotic stimulus (black bar) in the absence (top) or presence (bottom) of 10−7
m
Ang II (gray bar). B, Graph plotting the mean (±SEM) osmoreceptor potentials (depolarization) induced by osmotic stimuli applied in the absence and presence of Ang II. The solid lines are linear regressions through data points. C, Graph plotting the mean (±SEM) changes in firing rate (Δfiring) induced by osmotic stimuli applied in the absence and presence of Ang II. The lines are linear regressions through data points.
Figure 2.
Ang II does not affect osmometry. A, Graph plotting the mean (±SEM) values of nV recorded during osmotic stimulation (bar; amplitude indicated by the numbers at right) of MNCs under control conditions. B, Graph plotting the values of nV recorded from the same cells in the presence of Ang II. C, Graph plotting the mean (±SEM) steady-state values of nV observed under different osmotic conditions in the absence (control) and presence of Ang II. The lines are fits of the data sets using the Boyle van't Hoff equation. D, Bar graph plotting the mean (±SEM) values of the time constants describing the time course of changes in nV during osmotic stimulation in the absence (open bars) and presence (solid bars) of Ang II. Differences are not significant (p > 0.05).
Figure 3.
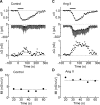
Ang II increases mechanosensitivity. A, Effects of applying negative pressure (−50 mmHg) to the recording pipette for 60 s (bar) on a cell recorded under control conditions. The top trace shows the change in nV, the middle trace shows the membrane current recorded under voltage clamp (V_hold, −60 mV). Negative deflections are the current responses (Δ_I) induced by hyperpolarizing steps (−40 mV; 500 ms). The bottom trace shows values of Δ_G_ computed from measurements of Δ_I_. B, Plot of the MI values computed from the data shown in the top traces. The dashed line represents the average of all MI values computed in this experiment. C, Effects of negative pressure (−50 mmHg) on another MNC recorded in the presence of Ang II (same layout as in A). Note the larger increases in Δ_I_ and Δ_G_. D, Values of MI computed from the data shown in C.
Figure 4.
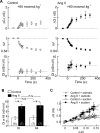
Ang II potentiates osmosensory transduction by enhancing mechanosensitivity. A, Mean (±SEM) values of Δ_G_ (top), nV (middle), and OI (bottom) observed in a group of control MNCs exposed to a +60 mosmol · kg−1 hypertonic stimulus (gray bar). B, Effect of the same hypertonic stimulus on a group of MNCs exposed to Ang II (same layout as in A). C, Bar graph plotting the mean (±SEM) values of MI and OI measured in MNCs under control conditions (open bars) and in the presence of Ang II (filled bars). *p < 0.05. n.s. indicates that the values are not significantly different. D, Plots superimposing all of the mean (±SEM) values of Δ_G_ and corresponding nΔ_V_ observed in cells stimulated using negative pressure (circles) or osmotic pressure (squares) in the absence (open symbols) or presence (filled symbols) of Ang II. The lines show regression fits through the four data sets.
Figure 5.
Ang II potentiates mechanosensitivity via the PLC-PKC pathway. Bar graphs show the mean (±SEM) values of MI recorded under various conditions. A, Values of MI in control (−Ang II; open bars) vs Ang II (+Ang II; filled bars) in vehicle (DMSO)-treated cells (Control) and in the presence of the PLC inhibitor U-73122. B, Values of MI observed in the absence (−Ang II; open bars) and presence (+Ang II; filled bars) of Ang II, in cells treated with vehicle (control) or Chel. C, Values of MI observed in the absence (−Ang II; open bars) and presence (+Ang II; filled bars) of Ang II, in cells patched with normal internal medium (Control) or medium containing 10 m
m
BAPTA. *p < 0.05. n.s., Difference not statistically significant.
Figure 6.
Ang II induces PKC-dependent increase in cortical F-actin density. A, Confocal images showing F-actin intensity in MNCs stained with Texas Red-labeled phalloidin. The top panels show examples of cells incubated under control conditions for the treatments shown in the bottom panels. The bottom panels show examples of MNCs exposed to 1 μ
m
Ang II for 5 min (left), Ang II and chelerythrine (Chel+Ang II; middle panel), or PMA (right). B, Line scan plots showing mean (±SEM) values of fluorescence (F-actin density; in bits) at the perimeter of cells exposed to the corresponding treatments shown in A. Note that significant differences are only observed in the ∼2 μm region that lies at the perimeter of the cells.
Figure 7.
An increase in F-actin density mediates the effects of Ang II on mechanosensitivity. Bar graphs plotting mean (±SEM) values of MI observed in the absence (−Ang II; open bars) and presence of Ang II (+Ang II; filled bars) under various conditions. A compares the effects of these treatments in the absence (control; left) or presence (right) of Cyt-D. B compares the effects of the treatments in the absence (left; control) or presence (right) of JSK. *p < 0.05. n.s., Difference not statistically significant.
Similar articles
- Actin filaments mediate mechanical gating during osmosensory transduction in rat supraoptic nucleus neurons.
Zhang Z, Kindrat AN, Sharif-Naeini R, Bourque CW. Zhang Z, et al. J Neurosci. 2007 Apr 11;27(15):4008-13. doi: 10.1523/JNEUROSCI.3278-06.2007. J Neurosci. 2007. PMID: 17428977 Free PMC article. - Osmosensation in vasopressin neurons: changing actin density to optimize function.
Prager-Khoutorsky M, Bourque CW. Prager-Khoutorsky M, et al. Trends Neurosci. 2010 Feb;33(2):76-83. doi: 10.1016/j.tins.2009.11.004. Epub 2009 Dec 4. Trends Neurosci. 2010. PMID: 19963290 Review. - PLCδ1 Plays Central Roles in the Osmotic Activation of ΔN-TRPV1 Channels in Mouse Supraoptic Neurons and in Murine Osmoregulation.
Park SJ, Haan KD, Nakamura Y, Fukami K, Fisher TE. Park SJ, et al. J Neurosci. 2021 Apr 21;41(16):3579-3587. doi: 10.1523/JNEUROSCI.2892-20.2021. Epub 2021 Mar 11. J Neurosci. 2021. PMID: 33707294 Free PMC article. - Stretch-inactivated cation channels: cellular targets for modulation of osmosensitivity in supraoptic neurons.
Bourque CW, Voisin DL, Chakfe Y. Bourque CW, et al. Prog Brain Res. 2002;139:85-94. doi: 10.1016/s0079-6123(02)39009-5. Prog Brain Res. 2002. PMID: 12436928 Review. - Coincident detection of CSF Na+ and osmotic pressure in osmoregulatory neurons of the supraoptic nucleus.
Voisin DL, Chakfe Y, Bourque CW. Voisin DL, et al. Neuron. 1999 Oct;24(2):453-60. doi: 10.1016/s0896-6273(00)80858-2. Neuron. 1999. PMID: 10571238
Cited by
- Actin fenestrae amplify the membrane response to hypertonic stress in osmosensory neurons.
Murtaz A, Bourque CW. Murtaz A, et al. iScience. 2025 Feb 17;28(3):112042. doi: 10.1016/j.isci.2025.112042. eCollection 2025 Mar 21. iScience. 2025. PMID: 40109380 Free PMC article. - Osmotic activation of a Ca2+-dependent phospholipase C pathway that regulates ∆N TRPV1-mediated currents in rat supraoptic neurons.
Bansal V, Fisher TE. Bansal V, et al. Physiol Rep. 2017 Apr;5(8):e13259. doi: 10.14814/phy2.13259. Physiol Rep. 2017. PMID: 28432255 Free PMC article. - Control of stem cell fate by physical interactions with the extracellular matrix.
Guilak F, Cohen DM, Estes BT, Gimble JM, Liedtke W, Chen CS. Guilak F, et al. Cell Stem Cell. 2009 Jul 2;5(1):17-26. doi: 10.1016/j.stem.2009.06.016. Cell Stem Cell. 2009. PMID: 19570510 Free PMC article. Review. - Osmotically evoked PLCδ1-dependent translocation of ΔN-TRPV1 channels in rat supraoptic neurons.
Haan KD, Park SJ, Nakamura Y, Fukami K, Fisher TE. Haan KD, et al. iScience. 2023 Feb 20;26(3):106258. doi: 10.1016/j.isci.2023.106258. eCollection 2023 Mar 17. iScience. 2023. PMID: 36926650 Free PMC article. - Inverse relationship between IL-6 and sodium levels in patients with COVID-19 and other respiratory tract infections: data from the COVIVA study.
Atila C, Monnerat S, Bingisser R, Siegemund M, Lampart M, Rueegg M, Zellweger N, Osswald S, Rentsch K, Christ-Crain M, Twerenbold R. Atila C, et al. Endocr Connect. 2022 Sep 26;11(10):e220171. doi: 10.1530/EC-22-0171. Print 2022 Oct 1. Endocr Connect. 2022. PMID: 36006851 Free PMC article.
References
- Akaishi T, Negoro H, Kobayasi S. Responses of paraventricular and supraoptic units to angiotensin II, sar1-ile8-angiotensin II and hypertonic NaCl administered into the cerebral ventricle. Brain Res. 1980;188:499–511. - PubMed
- Aoki H, Izumo S, Sadoshima J. Angiotensin II activates RhoA in cardiac myocytes: a critical role of RhoA in angiotensin II-induced premyofibril formation. Circ Res. 1998;82:666–676. - PubMed
- Barnes WG, Reiter E, Violin JD, Ren XR, Milligan G, Lefkowitz RJ. beta-Arrestin 1 and Galphaq/11 coordinately activate RhoA and stress fiber formation following receptor stimulation. J Biol Chem. 2005;280:8041–8050. - PubMed
- Bleasdale JE, Bundy GL, Bunting S, Fitzpatrick FA, Huff RM, Sun FF, Pike JE. Inhibition of phospholipase C dependent processes by U-73, 122. Adv Prostaglandin Thromboxane Leukot Res. 1989;19:590–593. - PubMed
- Bourque CW. Central mechanisms of osmosensation and systemic osmoregulation. Nat Rev Neurosci. 2008;9:519–531. - PubMed
Publication types
MeSH terms
Substances
LinkOut - more resources
Full Text Sources
Medical


