Systematic bioinformatic analysis of expression levels of 17,330 human genes across 9,783 samples from 175 types of healthy and pathological tissues - PubMed (original) (raw)
doi: 10.1186/gb-2008-9-9-r139. Epub 2008 Sep 19.
Reija Autio, Kalle Ojala, Kristiina Iljin, Elmar Bucher, Henri Sara, Tommi Pisto, Matti Saarela, Rolf I Skotheim, Mari Björkman, John-Patrick Mpindi, Saija Haapa-Paananen, Paula Vainio, Henrik Edgren, Maija Wolf, Jaakko Astola, Matthias Nees, Sampsa Hautaniemi, Olli Kallioniemi
Affiliations
- PMID: 18803840
- PMCID: PMC2592717
- DOI: 10.1186/gb-2008-9-9-r139
Systematic bioinformatic analysis of expression levels of 17,330 human genes across 9,783 samples from 175 types of healthy and pathological tissues
Sami Kilpinen et al. Genome Biol. 2008.
Abstract
Our knowledge on tissue- and disease-specific functions of human genes is rather limited and highly context-specific. Here, we have developed a method for the comparison of mRNA expression levels of most human genes across 9,783 Affymetrix gene expression array experiments representing 43 normal human tissue types, 68 cancer types, and 64 other diseases. This database of gene expression patterns in normal human tissues and pathological conditions covers 113 million datapoints and is available from the GeneSapiens website.
Figures
Figure 1
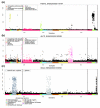
Multidimensional scaling (MDS) of Q normalized data before and after AGC correction. MDS was performed using 1,137 healthy in vivo samples representing 15 tissue categories with 7,390 genes in common without missing values. Color codes show the array generation of each sample for panles on the left-hand side and the high level anatomical system from which samples originate for panels on the right-hand side. (a, b) Clustering of samples in Q normalized data without AGC correction. (a) Clustering driven dominantly by the array generations, but some biological division can be seen in the form of some division within the large clusters. (b) Several tissue classes are separated into two or more clusters due to the different array generation of origin. (c, d) After QAGC, array generations no longer define clusters (c) but instead tissue types form distinct clusters (d).
Figure 2
Boxplots of correlations between the replicated samples after each step of the data normalization process. All boxes for which notches do not overlap vertically have significantly (α = 0.05) different median values. On the left is a sample set from 14 human muscle biopsy samples measured with array generations U95Av2 and U133A. The correlations computed based on the QAGC-normalized data are significantly higher when compared to MAS5 and Q methods. On the right, all correlations between 123 leukemia samples are plotted. The samples are from three different array generations U95Av2, U133A, and U133B. The first column illustrates correlations between all replicates together (369 correlation values), and in the other columns the correlations are grouped based on the array generation pairs. When the mean values of the correlations computed with each method were compared, the values in the QAGC data were significantly higher.
Figure 3
Detailed expression profiles of TNNT2, ALPP and MAG. (a) TNNT2 is a clinically used cardiac biomarker and, as expected, it shows heart-specific expression. In addition, it has been shown that TNNT2 has elevated expression in some cases of rhabdomyosarcoma, also visible from the profile. (b) ALPP had high expression in placenta and somewhat elevated expression in uterine tumors. Additionally, serous ovarian tumors showed elevated expression when compared to the mucinous ones. (c) Known neuronal marker gene MAG similarly shows an expression profile that was highly central nervous system specific.
Figure 4
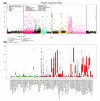
Detailed gene expression profile of PRAME. (a) Body-wide expression profile of the PRAME gene across the database. Each dot represents the expression of PRAME in one sample. Anatomical origins of each sample are marked with colored bars below the gene plot. Sample types having higher than average expression or an outlier expression profile are additionally colored in the figure (legend at the top left corner). The PRAME gene is a highly testis-specific gene in normal samples, but is ectopically expressed across the majority of human cancers. Gene plots like these can easily be used to identify outlier expression profiles, like as can be seen for kidney cancer in this case, where only a small fraction of the tumors are PRAME positive. (b) Box plot analysis of the PRAME expression levels across a variety of normal and cancer tissues. The number of samples in each category is shown in parentheses. Normal tissues are shown with green boxes and cancerous ones with red boxes. The box refers to the quartile distribution (25-75%) range, with the median shown as a black horizontal line. In addition, the 95% range and individual outlier samples are shown.
Figure 5
Body-wide expression map of known cancer genes. On the x-axis are 342 genes and on the y-axis are 110 in vivo tissues (both healthy and malignant) from human. The color indicates the mean expression value of each gene in each tissue. Grey color signifies missing values. Values have been gene-wise scaled (mean 0 and standard deviation 1). Both axes have been clustered by using Euclidean distance with complete linkage method. Below the expression map are gene-wise Pearson correlation coefficients with four known cellular process/tissue-specific marker genes (Ki-67, PCNA, KRT19 and PTPRC). Correlations have been calculated over 8,409 healthy and malignant samples using pairwise complete observations. Comparison of highest correlation values and clusters of genes on the expression map confirm that through the analysis of in silico transcriptomics data it is possible to find both tissue specificity and functional associations with processes such as cell cycle. For example, the orange colored branch contains genes having highest correlation with epithelial marker KRT19, branches colored blue contain genes mostly expressed in the hematological system and they also correlate with PTPRC, a marker for hematological tissues. Additionally, genes related to mitosis cluster together (purple branch), having highest correlations with Ki-67 and PCNA. The rectangles (A, B, C) highlight three genes as examples of extreme expression in some cancers (see Figure 6 and Additional data files 7 and 8 for enlargements of these areas).
Figure 6
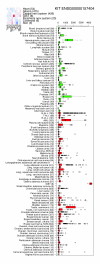
Expression profile for the KIT gene shows interesting patterns in the bodymap in Figure 5. KIT exhibits extremely high expression in gastrointestinal stromal tumors. KIT is known to be inhibited by Gleevec®, demonstrating that findings like these pinpoint immediate possibilities for drug repositioning.
Similar articles
- A compendium of gene expression in normal human tissues.
Hsiao LL, Dangond F, Yoshida T, Hong R, Jensen RV, Misra J, Dillon W, Lee KF, Clark KE, Haverty P, Weng Z, Mutter GL, Frosch MP, MacDonald ME, Milford EL, Crum CP, Bueno R, Pratt RE, Mahadevappa M, Warrington JA, Stephanopoulos G, Stephanopoulos G, Gullans SR. Hsiao LL, et al. Physiol Genomics. 2001 Dec 21;7(2):97-104. doi: 10.1152/physiolgenomics.00040.2001. Physiol Genomics. 2001. PMID: 11773596 - Cross-species comparison of gene expression between human and porcine tissue, using single microarray platform--preliminary results.
Shah G, Azizian M, Bruch D, Mehta R, Kittur D. Shah G, et al. Clin Transplant. 2004;18 Suppl 12:76-80. doi: 10.1111/j.1399-0012.2004.00223.x. Clin Transplant. 2004. PMID: 15217413 - Microarray-based discovery of highly expressed olfactory mucosal genes: potential roles in the various functions of the olfactory system.
Genter MB, Van Veldhoven PP, Jegga AG, Sakthivel B, Kong S, Stanley K, Witte DP, Ebert CL, Aronow BJ. Genter MB, et al. Physiol Genomics. 2003 Dec 16;16(1):67-81. doi: 10.1152/physiolgenomics.00117.2003. Physiol Genomics. 2003. PMID: 14570983 - Similar gene expression profiles do not imply similar tissue functions.
Yanai I, Korbel JO, Boue S, McWeeney SK, Bork P, Lercher MJ. Yanai I, et al. Trends Genet. 2006 Mar;22(3):132-8. doi: 10.1016/j.tig.2006.01.006. Epub 2006 Feb 9. Trends Genet. 2006. PMID: 16480787 Review. - Novel relational database for tissue microarray analysis.
Shaknovich R, Celestine A, Yang L, Cattoretti G. Shaknovich R, et al. Arch Pathol Lab Med. 2003 Apr;127(4):492-4. doi: 10.5858/2003-127-0492-NRDFTM. Arch Pathol Lab Med. 2003. PMID: 12683883 Review. No abstract available.
Cited by
- Microarray Gene Expression Analysis to Evaluate Cell Type Specific Expression of Targets Relevant for Immunotherapy of Hematological Malignancies.
Pont MJ, Honders MW, Kremer AN, van Kooten C, Out C, Hiemstra PS, de Boer HC, Jager MJ, Schmelzer E, Vries RG, Al Hinai AS, Kroes WG, Monajemi R, Goeman JJ, Böhringer S, Marijt WA, Falkenburg JH, Griffioen M. Pont MJ, et al. PLoS One. 2016 May 12;11(5):e0155165. doi: 10.1371/journal.pone.0155165. eCollection 2016. PLoS One. 2016. PMID: 27171398 Free PMC article. - PDE3A Is a Highly Expressed Therapy Target in Myxoid Liposarcoma.
Toivanen K, Kilpinen S, Ojala K, Merikoski N, Salmikangas S, Sampo M, Böhling T, Sihto H. Toivanen K, et al. Cancers (Basel). 2023 Nov 7;15(22):5308. doi: 10.3390/cancers15225308. Cancers (Basel). 2023. PMID: 38001568 Free PMC article. - Endocrine resistant breast cancer cells with loss of ERα expression retain proliferative ability by reducing caspase7-mediated HDAC3 cleavage.
Yu S, Gong X, Ma Z, Zhang M, Huang L, Zhang J, Zhao S, Zhu T, Yu Z, Chen L. Yu S, et al. Cell Oncol (Dordr). 2020 Feb;43(1):65-80. doi: 10.1007/s13402-019-00439-x. Epub 2019 Nov 7. Cell Oncol (Dordr). 2020. PMID: 31701491 - Increased α-actinin-1 destabilizes E-cadherin-based adhesions and associates with poor prognosis in basal-like breast cancer.
Kovac B, Mäkelä TP, Vallenius T. Kovac B, et al. PLoS One. 2018 May 9;13(5):e0196986. doi: 10.1371/journal.pone.0196986. eCollection 2018. PLoS One. 2018. PMID: 29742177 Free PMC article. - Validation of proposed prostate cancer biomarkers with gene expression data: a long road to travel.
Amaro A, Esposito AI, Gallina A, Nees M, Angelini G, Albini A, Pfeffer U. Amaro A, et al. Cancer Metastasis Rev. 2014 Sep;33(2-3):657-71. doi: 10.1007/s10555-013-9470-4. Cancer Metastasis Rev. 2014. PMID: 24477410 Free PMC article. Review.
References
- Irizarry RA, Warren D, Spencer F, Kim IF, Biswal S, Frank BC, Gabrielson E, Garcia JG, Geoghegan J, Germino G, Griffin C, Hilmer SC, Hoffman E, Jedlicka AE, Kawasaki E, Martinez-Murillo F, Morsberger L, Lee H, Petersen D, Quackenbush J, Scott A, Wilson M, Yang Y, Ye SQ, Yu W. Multiple-laboratory comparison of microarray platforms[see comment][erratum appears in Nat Methods. 2005 Jun;2(6):477]. Nat Methods. 2005;2:345–350. doi: 10.1038/nmeth756. - DOI - PubMed
Publication types
MeSH terms
LinkOut - more resources
Full Text Sources
Other Literature Sources


