A polymeric protein anchors the chromosomal origin/ParB complex at a bacterial cell pole - PubMed (original) (raw)
A polymeric protein anchors the chromosomal origin/ParB complex at a bacterial cell pole
Grant R Bowman et al. Cell. 2008.
Abstract
Bacterial replication origins move towards opposite ends of the cell during DNA segregation. We have identified a proline-rich polar protein, PopZ, required to anchor the separated Caulobacter crescentus chromosome origins at the cell poles, a function that is essential for maintaining chromosome organization and normal cell division. PopZ interacts directly with the ParB protein bound to specific DNA sequences near the replication origin. As the origin/ParB complex is being replicated and moved across the cell, PopZ accumulates at the cell pole and tethers the origin in place upon arrival. The polar accumulation of PopZ occurs by a diffusion/capture mechanism that requires the MreB cytoskeleton. High molecular weight oligomers of PopZ assemble in vitro into a filamentous network with trimer junctions, suggesting that the PopZ network and ParB-bound DNA interact in an adhesive complex, fixing the chromosome origin at the cell pole.
Figures
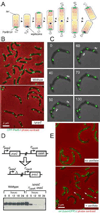
Figure 1. PopZ is required for the polar localization of chromosome origins
(A) Chromosome segregation in C. crescentus. The chromosome (solenoid structure in diagram) is organized such that the replication origin, in complex with ParB, is found at the flagellar pole, and the chromosome arms extend the length of the cell axis, ending at the replication terminus at the opposite pole. Chromosome replication is initiated with the formation of the replisome during the swarmer to stalked cell transition (1), and a copy of the duplicated origin, in complex with ParB, is rapidly translocated to the opposite pole (2). The remaining bulk of chromosomal DNA follows this pattern of movement as it is replicated and segregated (3−5), allowing chromosome organization to be maintained in the daughter cells (6). (B) CFP-ParB localization in the presence and absence of PopZ. Strain MT190 (cfp-parB) is compared with strain GB308 (cfp-parB; Δ_popZ_). Cells were grown in minimal M2G media. Bar 2µm. (C) Time-lapse fluorescence microscopy of living cells demonstrates movement of the CFP-ParB foci towards and away from the cell poles in Δ_popZ_ cells. (see Movie M1 in Supplementary Material). Strain GB308 was grown in M2G, and cells were placed on an agarose pad for microscopic analysis. Images were collected every 10 minutes for 150 minutes. (D) Construction of the popZ depletion strain GB195 (Δ_popZ_; P**vanA**-popZ). To demonstrate PopZ depletion, wildtype and GB195 were grown in PYE + 500µM vanillate, then transferred to vanillate free medium. At the indicated times, an aliquot of the culture was removed for immunoblot analysis with anti-PopZ antibody. (E) Visualization of the origin region using the LacO/LacI-CFP FROS technique in a PopZ depletion strain. Strain GB196 ( popZ; P_vanA_-popZ; P_xylX_-lacI-cfp; CC0006::(lacO)n) was grown in PYE medium in the presence or absence of 500µM vanillate to control PopZ expression. Arrows point to polar foci. Bar 2µm.
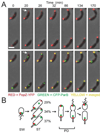
Figure 2. Upon initiation of DNA replication, PopZ co-localizes with the ori/ParB complex at the new pole
(A) Time-lapse analysis of CFP-ParB and PopZ-YFP localization. Swarmer cells were isolated from a culture of GB301 (cfp-parB; P**vanA**-popZ-yfp) grown in M2G. Vanillate was added at 50µM 2h prior to synchronization of the cell culture. Swarmer cells were placed on an agar pad, and images were collected at the indicated times. Top panels: PopZ-YFP (red) over phase contrast image (grey); bottom panels: CFP-ParB (green) is added to show co-localization of the fluorescent markers (yellow). The arrow at the 20 min time point indicates a pole that accumulates PopZ-YFP before the arrival of the CFP-ParB focus. Bar 1µm. (B) Diagram showing the localization patterns of PopZ-YFP and CFP-ParB through the cell cycle. The percentage of cells showing the different patterns is indicated (n = 406 cells, from two separate experiments that differed by less than 10% in all categories).
Figure 3. PopZ interacts directly with ParB
(A) Co-immunoprecipitation assays show that PopZ forms a complex with ParB in vivo. Samples of the whole cell lysate (Ly) from strain GB135 (popZ-m2) and immunoprecipitated protein complexes (E) were probed with the indicated antibodies by western blot. (B) CFP-ParB was expressed in the presence (left panels) or absence (right panels) of PopZ-YFP in E. coli strain GB333. Cells were grown in LB media to an optical density range of 0.3–0.5, then CFP-ParB was induced with 0.1mM IPTG and PopZ-YFP was either induced with 0.2% L-arabinose or not induced in the presence of 0.2% D-arabinose (as indicated) for 2 hours. Although PopZ-YFP alone localized to one E. coli cell pole, polar localization of CFP-ParB only occurred when PopZ-YFP was present. (C) CFP (left panels) and DivK-CFP (right panels) were expressed in the presence of PopZ-YFP in E. coli strains GB342 and GB367, respectively. PopZ-YFP was induced with 0.2% L-arabinose, and either CFP or DivK-CFP was induced with 0.1mM IPTG or 0.01mM IPTG, respectively, to account for relative differences in expression level. (D) Surface Plasmon Resonance analysis of the interaction between PopZ, ParB, FtsZ or BSA in solution with immobilized ParB on the chip surface. Protein was injected at concentrations of 125, 250, and 500 nM (blue, red, and green lines, respectively, at time 0), followed by injection of BC buffer only (180 seconds) to observe dissociation. (E) Mobility shift assay. Radioactively labeled probe DNA (1.1 nM) was incubated in reaction buffer alone (lane 1); with 450 nM ParB (lane 2); with 450 nM ParB and 650 nM PopZ (lane3); or with 650 nM PopZ (lane 4). The DNA and DNA-protein complexes were resolved on a non-denaturing gel and visualized by autoradiography. The control probe (without parS) is labeled with an asterisk.
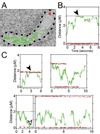
Figure 4. Visualization of single PopZ-YFP molecules in live cells
(A) Time lapse visualization of two molecules in a cell, with colored lines tracking the distance moved between 32.2 msec frames. One molecule (red) remains localized to the pole, and the other (green) has increased mobility. The tracks are overlaid on a transmitted light image of the cell, outlined in black. (B) A representation of the data from the experiment in A, showing the distance of the molecules from one pole as a function of time. The black horizontal dotted line marks the opposite pole; the red and green lines follow the stationary and mobilized molecules, respectively. (C) A sampling of the time-dependent behavior of single molecules in other cells. For all graphs, the colored lines are dotted during dark (blinking-off) periods. The cells are strain GB175 (P**vanA**-popZ-yfp), grown without vanillate in M2G medium.
Figure 5. MreB activity is required for the polar localization and maintenance of PopZ
(A) A22 inhibits the formation of PopZ-YFP foci at the new pole. Strain GB301 (cfp-parB; P**vanA-popZ-yfp) was grown in M2G medium, and PopZ-YFP expression was induced by the addition of 50µM vanillate for 2 hours before dividing the cells into two fractions for synchronization. One fraction was treated with 10µM A22 during synchrony. The isolated swarmer cells were allowed to grow on an agarose pad containing M2G media with or without A22 at room temperature. After 2 hours, the number of cells with one or two polar PopZ-YFP foci were quantified (+A22 n=922; no A22 n=664). A22 treatment inhibited the translocation of CFP-ParB foci to a similar degree (not shown). The data was collected from two independent experiments, which differed by less than 2%. Similar results were obtained in cultures grown in liquid media. (B) MreB depletion causes de-localization of PopZ-YFP polar foci. Strain GB325 (Δ_mreB_; pMR10+PxylX-mreB; PvanA**-popZ-yfp) was grown for 24 hrs in M2G medium supplemented with 0.03% xylose (top panels) or in M2G medium without xylose (bottom panels) and stimulated with 50µM vanillate for 2 hrs prior to microscopic analysis. Left panels: phase contrast images; right panels: PopZ-YFP fluorescence. (C) A22 inhibits the polar localization of heterologously expressed PopZ-YFP. E. coli strain GB297 was grown to log phase in LB media and supplemented with either 0.2% L-arabinose (for PopZ-YFP expression, top panel) or 0.2% arabinose plus 10µM A22 (bottom panel) for 105 minutes prior to microscopic analysis. PopZ-YFP fluorescence (red) is overlaid on the phase contrast image.
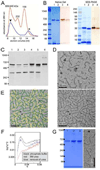
Figure 6. PopZ assembles into a structured oligomer in vitro
(A) Size analysis of 6His-PopZ complexes purified from E. coli by gel filtration. Elution volume (X-axis) is plotted against absorbance at 280nm (Y-axis). The red trace shows the profile of molecular weight standards (size indicated above peaks), the blue trace is the profile of purified 6His-PopZ. The first peak (arrowhead) was determined to be PopZ by analyzing the corresponding fractions by SDS-PAGE and Coomassie staining; the second peak (asterisk) contained proteins that do not match the MW of PopZ. (B) Analysis of purified PopZ by electrophoresis. His6-PopZ was purified from an E. coli lysate and separated by native gel electrophoresis (left panel) and SDS-PAGE (right panel), with molecular weight standards (in kDa) in the left-most lane. The gels were analyzed by either Coomassie staining (lanes 1 and 2) or western blotting with anti-PopZ antibody (lanes 3 and 4). In lanes 2 and 4, the 6His tag was cleaved with thrombin protease before loading. (C) PopZ assembles into high molecular weight complexes in vivo. Proteins were isolated from whole cell lysates of wildtype cells, separated by native gel electrophoresis, and analyzed by immunoblotting with an anti-PopZ antibody. Lanes 1,4, and 5 contain lysates of C. crescentus cells (7 mg total protein) from a wildtype strain (lane 1), and MreB depletion strain LS3809 in the presence (lane 4) and absence (lane 5) of xylose-induced MreB expression; lanes 2–3 are lysates from E. coli strain GB296 (0.3 mg total protein) that were induced to express PopZ heterologously by the addition of 0.2% L-arabinose for 100 minutes prior to lysis, either left untreated (lane 2) or treated with 10 µM A22 for 3.5 hrs prior to lysis (lane 3); lane 6 contains approximately 3 ng of purified PopZ protein. (D) Transmission electron micrographs of PopZ complexes. Purified PopZ diluted to 49 µg/ml (top panel) or 54 µg/ml (bottom panel) was placed on a carbon coated grid, negatively stained, and viewed at 86,000X magnification. (E) PopZ filament assemblies are connected by 3-way junctions. The filaments in D were traced with a green line, and examples of 3-way junctions were circled in yellow. The field also contains a small number of 4-way junctions. (F–G) PopZ filaments self-assemble in vitro. Purified PopZ was denatured in 1M urea or 8M urea, then allowed to renature by dialysis into buffer without urea. (F) Denaturation of the sample in 8M urea was confirmed by Small Angle X-ray Scattering (SAXS). The data is represented in a Kratky plot, in which folded proteins have parabolic features. The near elimination of this feature in the urea containing sample indicates that this sample is significantly unfolded compared to the original and renatured samples. (G) Purified PopZ (lane 1) was compared with renatured material from samples placed in 1M urea (lane 2) or 8M urea (lane 3) on a native gel stained with Coomassie (left panel), and the material that was recovered from 8M urea was analyzed by electron microscopy, as in D (right panel).
Comment in
- Grasping at origins.
Ramamurthi KS, Losick R. Ramamurthi KS, et al. Cell. 2008 Sep 19;134(6):916-8. doi: 10.1016/j.cell.2008.09.004. Cell. 2008. PMID: 18805084
Similar articles
- A self-associating protein critical for chromosome attachment, division, and polar organization in caulobacter.
Ebersbach G, Briegel A, Jensen GJ, Jacobs-Wagner C. Ebersbach G, et al. Cell. 2008 Sep 19;134(6):956-68. doi: 10.1016/j.cell.2008.07.016. Cell. 2008. PMID: 18805089 Free PMC article. - Bacterial scaffold directs pole-specific centromere segregation.
Ptacin JL, Gahlmann A, Bowman GR, Perez AM, von Diezmann L, Eckart MR, Moerner WE, Shapiro L. Ptacin JL, et al. Proc Natl Acad Sci U S A. 2014 May 13;111(19):E2046-55. doi: 10.1073/pnas.1405188111. Epub 2014 Apr 28. Proc Natl Acad Sci U S A. 2014. PMID: 24778223 Free PMC article. - Grasping at origins.
Ramamurthi KS, Losick R. Ramamurthi KS, et al. Cell. 2008 Sep 19;134(6):916-8. doi: 10.1016/j.cell.2008.09.004. Cell. 2008. PMID: 18805084 - Cell cycle regulation in Caulobacter: location, location, location.
Goley ED, Iniesta AA, Shapiro L. Goley ED, et al. J Cell Sci. 2007 Oct 15;120(Pt 20):3501-7. doi: 10.1242/jcs.005967. J Cell Sci. 2007. PMID: 17928306 Review. - Control of chromosome replication in caulobacter crescentus.
Marczynski GT, Shapiro L. Marczynski GT, et al. Annu Rev Microbiol. 2002;56:625-56. doi: 10.1146/annurev.micro.56.012302.161103. Epub 2002 Jan 30. Annu Rev Microbiol. 2002. PMID: 12142494 Review.
Cited by
- Phospho-signaling couples polar asymmetry and proteolysis within a membraneless microdomain in Caulobacter crescentus.
Ahmed YM, Brown LM, Varga K, Bowman GR. Ahmed YM, et al. Nat Commun. 2024 Oct 28;15(1):9282. doi: 10.1038/s41467-024-53395-y. Nat Commun. 2024. PMID: 39468040 Free PMC article. - Biomolecular condensates as stress sensors and modulators of bacterial signaling.
Sasazawa M, Tomares DT, Childers WS, Saurabh S. Sasazawa M, et al. PLoS Pathog. 2024 Aug 15;20(8):e1012413. doi: 10.1371/journal.ppat.1012413. eCollection 2024 Aug. PLoS Pathog. 2024. PMID: 39146259 Free PMC article. Review. - Three factors ParA, TipN, and DnaA-mediated chromosome replication initiation are contributors of centromere segregation in Caulobacter crescentus.
Letzkus M, Trela C, Mera PE. Letzkus M, et al. Mol Biol Cell. 2024 May 1;35(5):ar68. doi: 10.1091/mbc.E23-12-0503. Epub 2024 Apr 3. Mol Biol Cell. 2024. PMID: 38568781 Free PMC article. - Macromolecular Crowding, Phase Separation, and Homeostasis in the Orchestration of Bacterial Cellular Functions.
Monterroso B, Margolin W, Boersma AJ, Rivas G, Poolman B, Zorrilla S. Monterroso B, et al. Chem Rev. 2024 Feb 28;124(4):1899-1949. doi: 10.1021/acs.chemrev.3c00622. Epub 2024 Feb 8. Chem Rev. 2024. PMID: 38331392 Free PMC article. Review. - TipN's involvement with centromere segregation in Caulobacter crescentus.
Letzkus M, Trela C, Mera PE. Letzkus M, et al. bioRxiv [Preprint]. 2023 Dec 21:2023.12.20.572679. doi: 10.1101/2023.12.20.572679. bioRxiv. 2023. PMID: 38187783 Free PMC article. Updated. Preprint.
References
- Barak I, Wilkinson AJ. Where asymmetry in gene expression originates. Mol Microbiol. 2005;57:611–620. - PubMed
- Ben-Yehuda S, Fujita M, Liu XS, Gorbatyuk B, Skoko D, Yan J, Marko JF, Liu JS, Eichenberger P, Rudner DZ, Losick R. Defining a centromerelike element in Bacillus subtilis by Identifying the binding sites for the chromosome-anchoring protein RacA. Mol Cell. 2005;17:773–782. - PubMed
- Ben-Yehuda S, Rudner DZ, Losick R. RacA, a bacterial protein that anchors chromosomes to the cell poles. Science. 2003;299:532–536. - PubMed
- Carballido-Lopez R, Formstone A, Li Y, Ehrlich SD, Noirot P, Errington J. Actin homolog MreBH governs cell morphogenesis by localization of the cell wall hydrolase LytE. Dev Cell. 2006;11:399–409. - PubMed
- Divakaruni AV, Baida C, White CL, Gober JW. The cell shape proteins MreB and MreC control cell morphogenesis by positioning cell wall synthetic complexes. Mol Microbiol. 2007;66:174–188. - PubMed
Publication types
MeSH terms
Substances
Grants and funding
- F32GM080008/GM/NIGMS NIH HHS/United States
- 5 P20 HG003638-02/HG/NHGRI NIH HHS/United States
- GM051426/GM/NIGMS NIH HHS/United States
- R24 GM073011/GM/NIGMS NIH HHS/United States
- P20 HG003638/HG/NHGRI NIH HHS/United States
- GM32506/GM/NIGMS NIH HHS/United States
- F32 GM080008-01/GM/NIGMS NIH HHS/United States
- R01 GM051426/GM/NIGMS NIH HHS/United States
- R01 GM032506/GM/NIGMS NIH HHS/United States
- 5R24GM73011-3/GM/NIGMS NIH HHS/United States
- R37 GM032506/GM/NIGMS NIH HHS/United States
- F32 GM080008/GM/NIGMS NIH HHS/United States
LinkOut - more resources
Full Text Sources
Other Literature Sources
Molecular Biology Databases
Research Materials


