Self-renewal and expansion of single transplanted muscle stem cells - PubMed (original) (raw)
. 2008 Nov 27;456(7221):502-6.
doi: 10.1038/nature07384. Epub 2008 Sep 17.
Affiliations
- PMID: 18806774
- PMCID: PMC2919355
- DOI: 10.1038/nature07384
Self-renewal and expansion of single transplanted muscle stem cells
Alessandra Sacco et al. Nature. 2008.
Abstract
Adult muscle satellite cells have a principal role in postnatal skeletal muscle growth and regeneration. Satellite cells reside as quiescent cells underneath the basal lamina that surrounds muscle fibres and respond to damage by giving rise to transient amplifying cells (progenitors) and myoblasts that fuse with myofibres. Recent experiments showed that, in contrast to cultured myoblasts, satellite cells freshly isolated or satellite cells derived from the transplantation of one intact myofibre contribute robustly to muscle repair. However, because satellite cells are known to be heterogeneous, clonal analysis is required to demonstrate stem cell function. Here we show that when a single luciferase-expressing muscle stem cell is transplanted into the muscle of mice it is capable of extensive proliferation, contributes to muscle fibres, and Pax7(+)luciferase(+) mononucleated cells can be readily re-isolated, providing evidence of muscle stem cell self-renewal. In addition, we show using in vivo bioluminescence imaging that the dynamics of muscle stem cell behaviour during muscle repair can be followed in a manner not possible using traditional retrospective histological analyses. By imaging luciferase activity, real-time quantitative and kinetic analyses show that donor-derived muscle stem cells proliferate and engraft rapidly after injection until homeostasis is reached. On injury, donor-derived mononucleated cells generate massive waves of cell proliferation. Together, these results show that the progeny of a single luciferase-expressing muscle stem cell can both self-renew and differentiate after transplantation in mice, providing new evidence at the clonal level that self-renewal is an autonomous property of a single adult muscle stem cell.
Figures
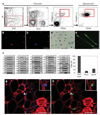
Figure 1. Characterization of the integrin-α7+CD34+ fraction as muscle stem cells
a, Flow cytometry analysis of freshly isolated muscle cells. Living cells were gated for forward scatter (FSC) and propidium iodide (PI) negativity (left panel). Cells negative for blood markers CD45 and CD11b, for endothelial marker CD31 and for mesenchymal marker Sca1 were gated (middle-left panel), and within this population the integrin-α7+CD34+ fraction was sorted (right panels). b, c, Forty-eight hours after isolation, muscle integrin-α7+CD34+ cells were stained for Pax7 (left: Pax7, red; right: nuclei, blue). Scale bar, 80 µm. d, After 5 days of culture in growth medium, integrin-α7+CD34+ cells isolated from Myf5-nLacZHet mice showed β-gal activity. Scale bar, 80 µm. e, After 3 days of culture in differentiation medium, integrin-α7+CD34+ cells (from _GFP_-transgenic mice) differentiated to form myotubes (green) that expressed myogenin (red). Scale bar, 80 µm. f, Single MuSCs (1–40) were individually sorted and reverse transcription followed by polymerase chain reaction performed as described in Supplementary Methods. The results show that this population consistently and homogeneously expresses Pax7 and Myf5, the expected transcriptional profile for satellite cells–. In contrast, both MyoD and Pax3 expression are heterogeneous, indicating the presence of committed progenitors, in accordance with previously published reports–. g, h, Freshly isolated integrin-α7+CD34+ cells from Myf5-nLacZHet mice were transplanted into recipient mice. One month after transplant, recipient muscles were damaged by NTX injection and 5 days later immunofluorescence of transverse tissue sections revealed Myf5–β-gal+ cells engrafted in the satellite cell position (arrowhead and inset). β-gal, green; laminin, red; nuclei, blue. Scale bars, 20 µm.
Figure 2. MuSC engraftment monitored by in vivo non-invasive bioluminescence imaging
a, Increasing numbers of myoblasts isolated from Myf5-nLacZ/FLuc mice were injected into the tibialis anterior muscles of NOD/SCID recipients and imaged 2 h after injection. Shown is a graph of bioluminescence data represented as average ± s.e.m. (n = 4; P ≤ 0.05; left) and a bioluminescent image of representative injected mice, with the number of cells injected indicated at the top (bioluminescence values are indicated as photons cm−2 s−1 × 10⁴; right). b, Top, freshly isolated MuSCs or cultured myoblasts from double-transgenic mice were injected into recipients and imaged four weeks after transplantation (n = 4; P < 0.005; bioluminescence values are indicated as photons cm−2 s−1 × 10⁵). Middle panels, immunofluorescence of luciferase expression in transverse muscle sections reveal the contribution of MuSCs, not of myoblasts, to muscle fibres. Laminin, red; luciferase, green; nuclei, blue. Scale bars, 100 µm. Bottom, 5 days before tissue harvesting, muscles were damaged with NTX. β-gal staining revealed Myf5–β-gal+ cells in muscles transplanted with MuSCs, not with myoblasts. Scale bars, 100 µm. c, Different numbers of MuSCs were injected into muscles of recipients (n = 50), and engraftment was measured by imaging four weeks after transplantation (uninjected legs are shown as negative control, ctr). A scattered graph of bioluminescent values of individual mice (top) and a histogram graph showing the percentages of mice with successful engraftment for each number of cells injected are shown (bottom). d, Engraftment of MuSCs (5,000, 500, 10) was monitored by imaging over a period of six weeks after transplantation (average ± s.e.m.; n = 3; P < 0.05). e, Freshly isolated MuSCs or cultured myoblasts were transplanted into recipients and engraftment was monitored by imaging over a period of six weeks after transplantation. Bioluminescent images of representative injected mice acquired at the indicated days are shown (bioluminescence values are indicated as photons cm−2 s−1 × 10⁴; left). Graph of bioluminescence measurements (average ± s.e.m., n = 5; P < 0.05, right). f, MuSCs from GFP/FLuc transgenic mice were transplanted into recipients. Four weeks later, mice were analysed by bioluminescence imaging and for histology. Regression analysis shows a significant (n = 10, P < 0.0001) correlation between the number of GFP+ myofibres and luciferase activity in individual mice (left). Representative images of immunofluorescence (GFP, green; laminin, red; nuclei, blue; scale bar, 120 µm) and bioluminescence imaging (bioluminescence values are indicated as photons cm−2 s−1 × 10⁵; right).
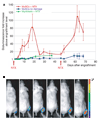
Figure 3. MuSC proliferation in response to muscle tissue damage
a, A low number of MuSCs (10–500) was transplanted into recipients (n = 10). After the engraftment plateau was reached (as in Fig. 2d), mice were divided into two groups, and the tibialis anterior muscles of one group were damaged by NTX injection, resulting in a substantial increase in cell numbers. At 47 days after the first damage, a second NTX injection led to a second increase in cell number, whereas no significant change was detected in the undamaged group. As a comparison, high numbers of primary myoblasts (4 × 10⁵) were transplanted into recipients and four weeks later muscles were damaged by NTX injection. The average bioluminescence fold increase ± s.e.m. is shown (n = 5; P < 0.05). b, Bioluminescent images of a representative animal transplanted with MuSCs and damaged with NTX acquired on the days indicated (top). Bioluminescence values are indicated as photons cm−2 s−1 × 10⁴.
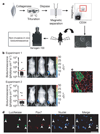
Figure 4. Transplantation of a single MuSC demonstrates self-renewal capacity
a, Scheme of single MuSC transplantation. Cells were isolated from Myf5-nLacZ/FLuc transgenic mice by FACS as in Fig. 1a, segregated as single cells in hydrogel microwells (< 10 µl per microwell; scale bars, 150 µm), individually picked by micromanipulation and transplanted into tibialis anterior muscles of recipient mice. b, Two independent experiments are shown (_n_= 6/144), and in each case 3 out of 72 single cell transplants resulted in engraftment above background detected by imaging mice four weeks after transplantation (left). Bioluminescent images of the 6 positive recipients after single MuSC transplantation (bioluminescence values are indicated as photons cm−2 s−1 × 10⁴; right). c, Immunofluorescence of luciferase expression in transverse muscle sections from the mice in b revealed the contribution of single MuSC progeny to muscle fibres. Laminin, red; luciferase, green; nuclei, blue. Scale bars, 50 µm. d, Muscle cells were re-isolated from mice transplanted with single cells, and donor-derived luciferase+Pax7+ cells were detected. Scale bars, 100 µm.
Similar articles
- Isolation, culture and immunostaining of skeletal muscle fibres to study myogenic progression in satellite cells.
Moyle LA, Zammit PS. Moyle LA, et al. Methods Mol Biol. 2014;1210:63-78. doi: 10.1007/978-1-4939-1435-7_6. Methods Mol Biol. 2014. PMID: 25173161 - Dormancy and quiescence of skeletal muscle stem cells.
Rocheteau P, Vinet M, Chretien F. Rocheteau P, et al. Results Probl Cell Differ. 2015;56:215-35. doi: 10.1007/978-3-662-44608-9_10. Results Probl Cell Differ. 2015. PMID: 25344673 Review. - All muscle satellite cells are equal, but are some more equal than others?
Zammit PS. Zammit PS. J Cell Sci. 2008 Sep 15;121(Pt 18):2975-82. doi: 10.1242/jcs.019661. J Cell Sci. 2008. PMID: 18768931 Review. - Paraxial mesodermal progenitors derived from mouse embryonic stem cells contribute to muscle regeneration via differentiation into muscle satellite cells.
Sakurai H, Okawa Y, Inami Y, Nishio N, Isobe K. Sakurai H, et al. Stem Cells. 2008 Jul;26(7):1865-73. doi: 10.1634/stemcells.2008-0173. Epub 2008 May 1. Stem Cells. 2008. PMID: 18450822 - Slow-dividing satellite cells retain long-term self-renewal ability in adult muscle.
Ono Y, Masuda S, Nam HS, Benezra R, Miyagoe-Suzuki Y, Takeda S. Ono Y, et al. J Cell Sci. 2012 Mar 1;125(Pt 5):1309-17. doi: 10.1242/jcs.096198. Epub 2012 Feb 20. J Cell Sci. 2012. PMID: 22349695
Cited by
- Muscle Satellite Cells: Exploring the Basic Biology to Rule Them.
Almeida CF, Fernandes SA, Ribeiro Junior AF, Keith Okamoto O, Vainzof M. Almeida CF, et al. Stem Cells Int. 2016;2016:1078686. doi: 10.1155/2016/1078686. Epub 2016 Mar 3. Stem Cells Int. 2016. PMID: 27042182 Free PMC article. Review. - Mimicking the niche: cytokines expand muscle stem cells.
Quarta M, Rando TA. Quarta M, et al. Cell Res. 2015 Jul;25(7):761-2. doi: 10.1038/cr.2015.78. Epub 2015 Jun 26. Cell Res. 2015. PMID: 26113258 Free PMC article. - Cellular adaptation to biomechanical stress across length scales in tissue homeostasis and disease.
Gilbert PM, Weaver VM. Gilbert PM, et al. Semin Cell Dev Biol. 2017 Jul;67:141-152. doi: 10.1016/j.semcdb.2016.09.004. Epub 2016 Sep 15. Semin Cell Dev Biol. 2017. PMID: 27641825 Free PMC article. Review. - Transplantation of PSC-derived myogenic progenitors counteracts disease phenotypes in FSHD mice.
Azzag K, Bosnakovski D, Tungtur S, Salama P, Kyba M, Perlingeiro RCR. Azzag K, et al. NPJ Regen Med. 2022 Sep 2;7(1):43. doi: 10.1038/s41536-022-00249-0. NPJ Regen Med. 2022. PMID: 36056021 Free PMC article. - The Spindle Assembly Checkpoint Safeguards Genomic Integrity of Skeletal Muscle Satellite Cells.
Kollu S, Abou-Khalil R, Shen C, Brack AS. Kollu S, et al. Stem Cell Reports. 2015 Jun 9;4(6):1061-74. doi: 10.1016/j.stemcr.2015.04.006. Epub 2015 May 7. Stem Cell Reports. 2015. PMID: 25960061 Free PMC article.
References
- Charge SB, Rudnicki MA. Cellular and molecular regulation of muscle regeneration. Physiol. Rev. 2004;84:209–238. - PubMed
- Montarras D, et al. Direct isolation of satellite cells for skeletal muscle regeneration. Science. 2005;309:2064–2067. - PubMed
Publication types
MeSH terms
Substances
Grants and funding
- R37 AG009521/AG/NIA NIH HHS/United States
- R01 AG024987-05/AG/NIA NIH HHS/United States
- AG024987/AG/NIA NIH HHS/United States
- R01 AG009521-25/AG/NIA NIH HHS/United States
- R01 AG024987/AG/NIA NIH HHS/United States
- AG009521/AG/NIA NIH HHS/United States
- R01 AG024987-04/AG/NIA NIH HHS/United States
- R01 AG020961-06A2/AG/NIA NIH HHS/United States
- R01 AG020961-07/AG/NIA NIH HHS/United States
- R01 AG020961/AG/NIA NIH HHS/United States
- R01 AG009521/AG/NIA NIH HHS/United States
- R01 AG009521-24/AG/NIA NIH HHS/United States
LinkOut - more resources
Full Text Sources
Other Literature Sources
Medical


