Association between active genes occurs at nuclear speckles and is modulated by chromatin environment - PubMed (original) (raw)
. 2008 Sep 22;182(6):1083-97.
doi: 10.1083/jcb.200803174.
Joanne Green, Ricardo Pires das Neves, Helen A C Wallace, Andrew J H Smith, Jim Hughes, Nicki Gray, Steve Taylor, William G Wood, Douglas R Higgs, Francisco J Iborra, Veronica J Buckle
Affiliations
- PMID: 18809724
- PMCID: PMC2542471
- DOI: 10.1083/jcb.200803174
Association between active genes occurs at nuclear speckles and is modulated by chromatin environment
Jill M Brown et al. J Cell Biol. 2008.
Abstract
Genes on different chromosomes can be spatially associated in the nucleus in several transcriptional and regulatory situations; however, the functional significance of such associations remains unclear. Using human erythropoiesis as a model, we show that five cotranscribed genes, which are found on four different chromosomes, associate with each other at significant but variable frequencies. Those genes most frequently in association lie in decondensed stretches of chromatin. By replacing the mouse alpha-globin gene cluster in situ with its human counterpart, we demonstrate a direct effect of the regional chromatin environment on the frequency of association, whereas nascent transcription from the human alpha-globin gene appears unaffected. We see no evidence that cotranscribed erythroid genes associate at shared transcription foci, but we do see stochastic clustering of active genes around common nuclear SC35-enriched speckles (hence the apparent nonrandom association between genes). Thus, association between active genes may result from their location on decondensed chromatin that enables clustering around common nuclear speckles.
Figures
Figure 1.
Associations between genes up-regulated in erythroblasts. (a) Chromosomal locations of the five genes analyzed. (b) Degree of associations between erythroid genes detected by DNA-FISH to intermediate erythroblasts and lymphoblasts. Allelic associations are depicted on the left, and inter-genic associations are depicted on the right. Allelic associations involving the HBA, SLC4A1, and ERAF genes are the most common in erythroblasts and demonstrate highly significant increases over the levels scored in lymphoblasts. The HBB and GATA1 genes are more frequently involved in inter-genic than allelic associations in erythroblasts. The scores for inter-genic associations in the right-hand chart represent the percent association per gene, not per cell, because many cells had both SLC4A1 genes involved in associations. GATA1 was scored only in female cells. Numbers of nuclei analyzed and individual p-values are given in Table I. Values represent the mean ± SD (error bars) from 2–22 independent experiments. These patterns of association mirrored those obtained by 3D hybridizations for α- and β-globin (Brown et al., 2006) and for SLC4A1 and ERAF (not depicted), although slightly higher values of association were obtained by 3D FISH. (c) Typical trans-associations between SLC4A1 (green) and ERAF (red) detected by DNA-FISH. Bar, 4 μm.
Figure 2.
Chromosomal environments differ between erythroid-specific genes. (a) Representative intermediate erythroblast nuclei after DNA-FISH of four 2-Mb BAC contigs. The nuclear periphery is outlined in red. The contig centered on the SLC4A1 gene on HSA17 shows marked decondensation of the chromatin region. The contig centered on the HBB gene on HSA11 does not exhibit the same levels of decondensation. The contig covering the mouse α-globin genes on MMU11 again does not display the levels of decondensation seen around SLC4A1. The contig covering the terminal 2 Mb of 16p13.3, surrounding the human α-globin genes, has been published previously (Brown et al., 2006) and is included here to demonstrate the marked difference in chromatin decondensation around the human and mouse α-globin genes. Note that the telomeric chromatin around HBA is more linearly extended than that around interstitial SLC4A1. (b) Maximum diameter measurements of BAC contig FISH signals in erythroblast and lymphoblast nuclei for SLC4A1, HBB, and mouse α-globin. These measurements minimize differences in signal size because they cannot take account of folding in the discontinuous SLC4A1 signal, yet there are significant differences between values for SLC4A1 and HBB and also for SLC4A1 and mouse α-globin. Values represent the mean ± SD (error bars) of measurements taken from one to two hybridizations for each contig probe set and cell type. Bar, 3 μm.
Figure 3.
Different levels of transcriptional activity surround erythroid up-regulated genes. Box plots showing the distribution of RNApolII across 2-Mb regions surrounding five erythroid up-regulated genes together with a box plot for the whole genome (All) for comparison. ERAF, HBA, and SLC4A1 all have higher than average densities of RNApolII bound to their surrounding chromatin regions. Data were extracted from high resolution maps for the genome-wide distribution of RNApolII in CD4+ T cells using the Solexa 1G sequencing technology (Barski et al., 2007).
Figure 4.
Positioning of human globin genes in a mouse chromatin environment. (a) Map of the α-globin genes and surrounding regulatory regions on HSA16 and MMU11. Red lines denote the region of human 16p13.3 that has been inserted into the corresponding region of the mouse α-globin locus in mouse embryonic stem cells through heterotypic lox sites in the DIST (rhomboid 5 homologue 1 [_Drosophila_] [RHBDF1]) and θ-globin genes. For a full explanation, see Wallace et al., 2007. (b) Heterozygous “humanized” α-globin mouse. Metaphase spread from spleen cells showing both MMU11 (blue), one with the endogenous mouse α-globin gene locus (red) and one with the human α-globin locus (green). (c) Position of α-globin genes with respect to chromosome territory. Human and mouse α-globin FISH signals (green) were scored as within or outside the MMU11 territory delineated by whole chromosome FISH paint (red). Nuclei are stained with DAPI (blue). In activated lymphocytes and erythroblasts (n = 300–550) from the heterozygous humanized mouse, endogenous mouse α-globin genes sat mainly at the MMU11 territory (n = 300), with the human α-globin genes behaving similarly in both cell types (n = 500–550). The normal mouse also shows the α-globin genes sitting mainly at their territory in both cell types (n = 100–150) and contrasts with the normal human situation in which ∼50% of the α-globin genes sit outside the HSA16 territory in both cell types (n = 200–500). (d) Association between globin genes in normal and humanized mouse erythroblasts. In normal mouse (n = 150–200), α-globin genes and α–β-globin genes associate with similar low frequencies. In normal human (n = 200), α-globin genes and α–β-globin genes associate much more frequently; however, in the humanized mouse (n = 300–500), both the human and the endogenous mouse α-globin genes and the human α-globin and mouse β-globin genes show association levels similar to that seen in the normal mouse. Therefore, in the humanized mouse, the human α-globin locus associates with other globin genes (hα–mα and hα–mβ) much less than in the normal human chromatin environment. Representative hybridizations to the humanized mouse are shown. (c and d) Values represent means ± SD (error bars) from two to five independent experiments. Bars, 4 μm.
Figure 5.
Associating genes are not commonly coincident. Measurements between globin RNA-FISH signals in intermediate erythroblasts. (a) Typical α–α (green-green) and α–β (green-red) associations. (b) Measurements between α-globin signals showing a bimodal distribution; a similar distribution was seen for α–β distances (not depicted). Values represent means ± SD (error bars) from two independent experiments. (c) Distances between associating α–α signals (HBA–HBA) and α–β signals (HBA–HBB) separated by <1 μm. Both have a mean separation of ∼0.5 μm. Values represent means ± SD from four independent experiments for both α–α associations and α–β associations. Bar, 4 μm.
Figure 6.
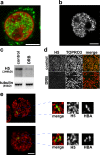
Transcription in intermediate erythroblasts. (a) Incorporation of BrUTP into active sites of transcription, showing a typical distribution of transcription foci (green) in a single confocal slice of a TOPRO3-stained nucleus (red). (b–d) H5 antibody detects the active elongating form of RNApolII. (b) Typical H5 immunofluorescence staining. (c and d) Incubation of erythroblasts with DRB inhibits elongation and results in reduced H5 signal by immunoblotting (c) and by immunofluorescence (d). (e) Associating globin genes (α–α associations and α–β associations) do not share common foci of RNApolII. The image shows a typical RNA immuno-FISH detection of α-globin (green) together with H5 antibody to RNApolII transcription foci (red). Associating globin signals are magnified to show that they sit at different transcription foci. Bars: (a, b, and e) 4 μm; (d) 40 μm.
Figure 7.
Positioning of multiple up-regulated genes. (a) M-FISH detection of concurrent associations between genes HBA, SLC4A1, ERAF, and HBB scored in erythroblast and lymphoblast nuclei. Up to seven FISH signals were found together in nuclear association in intermediate erythroblasts compared with a maximum of three in lymphoblasts. (b) M-FISH detection of HBA (red), SLC4A1 (green), ERAF (blue), and HBB (white) within erythroblast nuclei (gray). Associating signals are not grouped tightly around a single point but in a curvilinear manner. Panels (left to right) show groups of five, four, and three genes. Bar, 4 μm.
Figure 8.
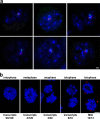
A role for nuclear speckles in interphase association of active genes. (a) Immuno-FISH of HBA (green) and SLC4A1 (red) with SC35-enriched nuclear speckles (blue) in intermediate erythroblasts showing that all four genes can be found in association and contacting the same speckle. (b) HBB is active before formation of nuclear speckles after mitosis. RNA-FISH for HBB detects transcripts (green) in interphase intermediate erythroblast nuclei but also in late telophase figures, when the SC35 protein (red) is still present in MIGs. DNA is stained with DAPI (blue). Bars: (a) 1 μm; (b) 4 μm.
Figure 9.
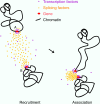
A model for involvement of splicing factor aggregations in the stochastic association of transcriptionally active genes. Genes in the process of transcriptional elongation accumulate splicing-related factors (left). Nuclear speckles are known to form as concentrations of such factors in early G1 and randomly during interphase. This process of nucleation may pull more mobile chromatin (around gene A) into association with other active genes (gene B; right).
Comment in
- Gene associations: true romance or chance meeting in a nuclear neighborhood?
Lawrence JB, Clemson CM. Lawrence JB, et al. J Cell Biol. 2008 Sep 22;182(6):1035-8. doi: 10.1083/jcb.200808121. J Cell Biol. 2008. PMID: 18809719 Free PMC article.
Similar articles
- Gene associations: true romance or chance meeting in a nuclear neighborhood?
Lawrence JB, Clemson CM. Lawrence JB, et al. J Cell Biol. 2008 Sep 22;182(6):1035-8. doi: 10.1083/jcb.200808121. J Cell Biol. 2008. PMID: 18809719 Free PMC article. - Coregulated human globin genes are frequently in spatial proximity when active.
Brown JM, Leach J, Reittie JE, Atzberger A, Lee-Prudhoe J, Wood WG, Higgs DR, Iborra FJ, Buckle VJ. Brown JM, et al. J Cell Biol. 2006 Jan 16;172(2):177-87. doi: 10.1083/jcb.200507073. J Cell Biol. 2006. PMID: 16418531 Free PMC article. - Active chromatin hub of the mouse alpha-globin locus forms in a transcription factory of clustered housekeeping genes.
Zhou GL, Xin L, Song W, Di LJ, Liu G, Wu XS, Liu DP, Liang CC. Zhou GL, et al. Mol Cell Biol. 2006 Jul;26(13):5096-105. doi: 10.1128/MCB.02454-05. Mol Cell Biol. 2006. PMID: 16782894 Free PMC article. - Regulation of the beta-globin locus.
Crossley M, Orkin SH. Crossley M, et al. Curr Opin Genet Dev. 1993 Apr;3(2):232-7. doi: 10.1016/0959-437x(93)90028-n. Curr Opin Genet Dev. 1993. PMID: 8504248 Review. - The mammalian beta globin origin of DNA replication.
Aladjem MI. Aladjem MI. Front Biosci. 2004 Sep 1;9:2540-7. doi: 10.2741/1415. Front Biosci. 2004. PMID: 15358579 Review.
Cited by
- Abundance and distribution of RNA polymerase II in Arabidopsis interphase nuclei.
Schubert V, Weisshart K. Schubert V, et al. J Exp Bot. 2015 Mar;66(6):1687-98. doi: 10.1093/jxb/erv091. Epub 2015 Mar 4. J Exp Bot. 2015. PMID: 25740920 Free PMC article. - Transcription factories.
Rieder D, Trajanoski Z, McNally JG. Rieder D, et al. Front Genet. 2012 Oct 23;3:221. doi: 10.3389/fgene.2012.00221. eCollection 2012. Front Genet. 2012. PMID: 23109938 Free PMC article. - The distribution of phosphorylated SR proteins and alternative splicing are regulated by RANBP2.
Saitoh N, Sakamoto C, Hagiwara M, Agredano-Moreno LT, Jiménez-García LF, Nakao M. Saitoh N, et al. Mol Biol Cell. 2012 Mar;23(6):1115-28. doi: 10.1091/mbc.E11-09-0783. Epub 2012 Jan 19. Mol Biol Cell. 2012. PMID: 22262462 Free PMC article. - Multilevel view on chromatin architecture alterations in cancer.
Gridina M, Fishman V. Gridina M, et al. Front Genet. 2022 Nov 18;13:1059617. doi: 10.3389/fgene.2022.1059617. eCollection 2022. Front Genet. 2022. PMID: 36468037 Free PMC article. Review. - Perispeckles are major assembly sites for the exon junction core complex.
Daguenet E, Baguet A, Degot S, Schmidt U, Alpy F, Wendling C, Spiegelhalter C, Kessler P, Rio MC, Le Hir H, Bertrand E, Tomasetto C. Daguenet E, et al. Mol Biol Cell. 2012 May;23(9):1765-82. doi: 10.1091/mbc.E12-01-0040. Epub 2012 Mar 14. Mol Biol Cell. 2012. PMID: 22419818 Free PMC article.
References
- Augui, S., G.J. Filion, S. Huart, E. Nora, M. Guggiari, M. Maresca, A.F. Stewart, and E. Heard. 2007. Sensing X chromosome pairs before X inactivation via a novel X-pairing region of the Xic. Science. 318:1632–1636. - PubMed
- Bacher, C.P., M. Guggiari, B. Brors, S. Augui, P. Clerc, P. Avner, R. Eils, and E. Heard. 2006. Transient colocalization of X-inactivation centres accompanies the initiation of X inactivation. Nat. Cell Biol. 8:293–299. - PubMed
- Barski, A., S. Cuddapah, K. Cui, T.Y. Roh, D.E. Schones, Z. Wang, G. Wei, I. Chepelev, and K. Zhao. 2007. High-resolution profiling of histone methylations in the human genome. Cell. 129:823–837. - PubMed
- Caron, H., B. van Schaik, M. van der Mee, F. Baas, G. Riggins, P. van Sluis, M.C. Hermus, R. van Asperen, K. Boon, P.A. Voute, et al. 2001. The human transcriptome map: clustering of highly expressed genes in chromosomal domains. Science. 291:1289–1292. - PubMed
Publication types
MeSH terms
Substances
Grants and funding
- MC_U137961143/MRC_/Medical Research Council/United Kingdom
- MC_U137961144/MRC_/Medical Research Council/United Kingdom
- MC_U137961145/MRC_/Medical Research Council/United Kingdom
- MC_U137973816/MRC_/Medical Research Council/United Kingdom
LinkOut - more resources
Full Text Sources
Other Literature Sources
Miscellaneous


