The spatial distribution of leprosy cases during 15 years of a leprosy control program in Bangladesh: an observational study - PubMed (original) (raw)
The spatial distribution of leprosy cases during 15 years of a leprosy control program in Bangladesh: an observational study
Eaj Fischer et al. BMC Infect Dis. 2008.
Abstract
Background: An uneven spatial distribution of leprosy can be caused by the influence of geography on the distribution of risk factors over the area, or by population characteristics that are heterogeneously distributed over the area. We studied the distribution of leprosy cases detected by a control program to identify spatial and spatio-temporal patterns of occurrence and to search for environmental risk factors for leprosy.
Methods: The houses of 11,060 leprosy cases registered in the control area during a 15-year period (1989-2003) were traced back, added to a geographic database (GIS), and plotted on digital maps. We looked for clusters of cases in space and time. Furthermore, relationships with the proximity to geographic features, such as town center, roads, rivers, and clinics, were studied.
Results: Several spatio-temporal clusters were observed for voluntarily reported cases. The cases within and outside clusters did not differ in age at detection, percentage with multibacillary leprosy, or sex ratio. There was no indication of the spread from one point to other parts of the district, indicating a spatially stable endemic situation during the study period. The overall risk of leprosy in the district was not associated with roads, rivers, and leprosy clinics. The risk was highest within 1 kilometer of town centers and decreased with distance from town centers.
Conclusion: The association of a risk of leprosy with the proximity to towns indicates that rural towns may play an important role in the epidemiology of leprosy in this district. Further research on the role of towns, particularly in rural areas, is warranted.
Figures
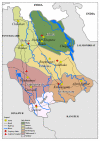
Figure 1
National, district, and sub-district borders, towns, clinics, rivers, roads, and railroad of Nilphamari district.
Figure 2
Temporal distribution of the included cases detected in Nilphamari district between 1989 and 2003. PB, paucibacillary; MB, multibacillary.
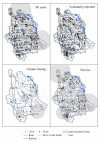
Figure 3
The cases registered between 1989 and 2003 in Nilphamari district (top left). Cases per detection mode and spatio-temporal clusters of leprosy cases detected in Nilphamari district for modes of detection, voluntarily reporting (top right), contact tracing (bottom left), and surveys (bottom right).
Similar articles
- The spatial distribution of leprosy in four villages in Bangladesh: an observational study.
Fischer E, Pahan D, Chowdhury S, Oskam L, Richardus J. Fischer E, et al. BMC Infect Dis. 2008 Sep 23;8:125. doi: 10.1186/1471-2334-8-125. BMC Infect Dis. 2008. PMID: 18811968 Free PMC article. - Patient contact is the major determinant in incident leprosy: implications for future control.
van Beers SM, Hatta M, Klatser PR. van Beers SM, et al. Int J Lepr Other Mycobact Dis. 1999 Jun;67(2):119-28. Int J Lepr Other Mycobact Dis. 1999. PMID: 10472363 - [Performance of leprosy case-contact surveillance: a space-time analysis in Bahia State, Northeast Brazil].
Souza EA, Ferreira AF, Pinto MSAP, Heukelbach J, Oliveira HX, Barbosa JC, Ramos AN Jr. Souza EA, et al. Cad Saude Publica. 2019 Sep 9;35(9):e00209518. doi: 10.1590/0102-311X00209518. Cad Saude Publica. 2019. PMID: 31508701 Portuguese. - Leprosy in Nkhotakota District Hospital.
Chisi JE, Nkhoma A, Zverev Y, Misiri H, Komolafe OO. Chisi JE, et al. East Afr Med J. 2003 Dec;80(12):635-9. doi: 10.4314/eamj.v80i12.8780. East Afr Med J. 2003. PMID: 15018420 - Risk factors for the development of clinical leprosy among contacts, and their relevance for targeted interventions.
Moet FJ, Meima A, Oskam L, Richardus JH. Moet FJ, et al. Lepr Rev. 2004 Dec;75(4):310-26. Lepr Rev. 2004. PMID: 15682969 Review.
Cited by
- Large-scale spatial population databases in infectious disease research.
Linard C, Tatem AJ. Linard C, et al. Int J Health Geogr. 2012 Mar 20;11:7. doi: 10.1186/1476-072X-11-7. Int J Health Geogr. 2012. PMID: 22433126 Free PMC article. Review. - Identifying clusters of leprosy patients in India: A comparison of methods.
Taal AT, Garg A, Lisam S, Agarwal A, Barreto JG, van Brakel WH, Richardus JH, Blok DJ. Taal AT, et al. PLoS Negl Trop Dis. 2022 Dec 16;16(12):e0010972. doi: 10.1371/journal.pntd.0010972. eCollection 2022 Dec. PLoS Negl Trop Dis. 2022. PMID: 36525390 Free PMC article. - Global elimination of leprosy by 2020: are we on track?
Blok DJ, De Vlas SJ, Richardus JH. Blok DJ, et al. Parasit Vectors. 2015 Oct 22;8:548. doi: 10.1186/s13071-015-1143-4. Parasit Vectors. 2015. PMID: 26490878 Free PMC article. - The spatial distribution of leprosy in four villages in Bangladesh: an observational study.
Fischer E, Pahan D, Chowdhury S, Oskam L, Richardus J. Fischer E, et al. BMC Infect Dis. 2008 Sep 23;8:125. doi: 10.1186/1471-2334-8-125. BMC Infect Dis. 2008. PMID: 18811968 Free PMC article. - Geographic information systems and applied spatial statistics are efficient tools to study Hansen's disease (leprosy) and to determine areas of greater risk of disease.
Queiroz JW, Dias GH, Nobre ML, De Sousa Dias MC, Araújo SF, Barbosa JD, Bezerra da Trindade-Neto P, Blackwell JM, Jeronimo SM. Queiroz JW, et al. Am J Trop Med Hyg. 2010 Feb;82(2):306-14. doi: 10.4269/ajtmh.2010.08-0675. Am J Trop Med Hyg. 2010. PMID: 20134009 Free PMC article.
References
- WHO Global leprosy situation, 2005. Weekly Epidemiological Record. 2005;80:289–295. - PubMed
- WHO Global leprosy situation, 2006. Weekly Epidemiological Record. 2006;81:309–316. - PubMed
- Montenegro ACD, Werneck GL, Kerr-Pontes LRS, Barreto ML, Feldmeier H. Spatial analysis of the distribution of leprosy in the state of Ceara, Northeast Brazil. Memorias Do Instituto Oswaldo Cruz. 2004;99:683–686. - PubMed
Publication types
MeSH terms
LinkOut - more resources
Full Text Sources
Medical


