Deletion of Mecp2 in Sim1-expressing neurons reveals a critical role for MeCP2 in feeding behavior, aggression, and the response to stress - PubMed (original) (raw)
Deletion of Mecp2 in Sim1-expressing neurons reveals a critical role for MeCP2 in feeding behavior, aggression, and the response to stress
Sharyl L Fyffe et al. Neuron. 2008.
Abstract
Rett Syndrome (RTT) is an autism spectrum disorder caused by mutations in the X-linked gene encoding methyl-CpG binding protein 2 (MeCP2). In order to map the neuroanatomic origins of the complex neuropsychiatric behaviors observed in patients with RTT and to uncover endogenous functions of MeCP2 in the hypothalamus, we removed Mecp2 from Sim1-expressing neurons in the hypothalamus using Cre-loxP technology. Loss of MeCP2 in Sim1-expressing neurons resulted in mice that recapitulated the abnormal physiological stress response that is seen upon MeCP2 dysfunction in the entire brain. Surprisingly, we also uncovered a role for MeCP2 in the regulation of social and feeding behaviors since the Mecp2 conditional knockout (CKO) mice were aggressive, hyperphagic, and obese. This study demonstrates that deleting Mecp2 in a defined brain region is an excellent approach to map the neuronal origins of complex behaviors and provides new insight about the function of MeCP2 in specific neurons.
Figures
Figure 1
Mecp2 CKO mice display a decreased amount of MeCP2 in the paraventricular nucleus (PVN) and the supraoptic nucleus (SON) of the hypothalamus compared to littermate controls. Detection of MeCP2 (red) by immunofluorescence in the PVN of mice carrying only the _Sim1_-cre transgene (A) and Mecp2 CKO mice (B) and in the SON of mice carrying only the Mecp2flox allele (C) and Mecp2 CKO mice (D). TOTO-3 staining in blue marks cell nuclei. White scale bar = 100 μm for panels A–B and 62.5 μm for C–D.
Figure 2
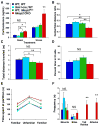
Deletion of Mecp2 from _Sim1_-expressing neurons results in an abnormal stress response, decreased movement in the center of an open field arena, and aggressive behaviors. (A) Serum corticosterone measurement by enzyme linked immunosorbent assay (ELISA) before and after 30 minutes of stress in Mecp2 CKO mice and control littermates (n=7–9/genotype). Under basal conditions, WT; Mecp2flox and Mecp2 CKO mice had higher serum corticosterone levels compared to _Sim1_-cre; WT mice, however, there was no significant difference between WT and Mecp2 CKO mice. After stress, Mecp2 CKO mice had significantly higher serum corticosterone levels compared to all littermates. (B) Open field analysis revealed that Mecp2 CKO mice had a lower center to total distance ratio compared to all littermate controls. (C) The total distance traveled during the open field assay was significantly less for WT; Mecp2flox and Mecp2 CKO mice compared to _Sim1_-cre; WT littermates. No significant differences were found between WT and Mecp2 CKO mice. (D) Mecp2 CKO mice spent a similar amount of time in the lit side of the light-dark box compared to all littermate controls. (E) Partition test for social interaction revealed that both WT; Mecp2flox (p<0.05) and Mecp2 CKO (p<0.01) mice spent significantly more time at the partition compared to their WT and _Sim1_-cre; WT littermates. N=15–17/genotype for panels B–E. (F) In the resident intruder assay (n=8/genotype) Mecp2 CKO mice exhibited significantly more tail rattles and attacks compared to all littermate controls. The colors used to denote genotypes are consistent for all graphs. *p<0.05, **p<0.01, NS=non significant for all panels. Error bars represent +/− standard error of the mean (SEM).
Figure 3
Mecp2 CKO mice have increased body weight and body fat. (A) Mecp2 CKO and WT littermate at 40 weeks of age. (B) Mecp2 CKO mice had significantly increased body weight compared to all littermate controls beginning at 7 weeks of age (n=15–17/genotype). (C) Mecp2 CKO mice had significantly increased intra-abdominal fat pad weight compared to all littermate controls (n=8/genotype). (D) Mecp2 CKO mice had significantly increased % body fat compared to WT controls as determined by DEXA scanning. The colors used to denote genotypes are consistent for all graphs. *p<0.05, **p<0.01, NS=non significant and error bars represent +/− SEM.
Figure 4
Mecp2 CKO mice have normal activity levels and basal metabolic rates but display increased food intake and serum leptin levels. (A) 24-hour total movement values over 8 days. No significant differences were identified after 4 days of acclimation. (B) Oxygen consumption values as measured by an indirect open circuit calorimeter system revealed no significant differences between genotypes. (C) 24-hour food intake values over 8 days. Mecp2 CKO mice consume significantly more chow than all of their control littermates. N=5–9/genotype for panels A–C. (D) Serum leptin measurement by ELISA at 6 weeks (n=4/genotype) and at 42 weeks (n=6–7/genotype) in Mecp2 CKO mice and control littermates. Mecp2 CKO mice had increased serum leptin levels compared to all littermate controls at 42 weeks but not at 6 weeks of age. The colors used to denote genotypes are consistent for all graphs. **p<0.01, ***p<0.001, NS=non significant and error bars represent +/− SEM.
Figure 5
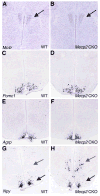
RNA in situ hybridization demonstrates that Mecp2 CKO mice have normal expression of Mc4r, Pomc1, and Agrp but increased Npy compared to WT controls. (A) Mc4r expression in WT PVN. (B) Mc4r expression in Mecp2 CKO PVN. (C) Pomc1 expression in WT ARC. (D) Pomc1 expression in Mecp2 CKO ARC. (E) Agrp expression in WT ARC and (F) Mecp2 CKO ARC. (G) Npy expression in WT DMH (gray arrow) and ARC (black arrow). (H) Npy expression is greatly increased in DMH (gray arrow) but decreased in the ARC (black arrow) of Mecp2 CKO mice compared to WT littermates.
Figure 6
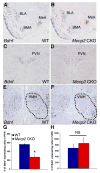
RNA in situ hybridization demonstrates that Mecp2 CKO mice display decreased expression of Bdnf in the PVN, but normal expression throughout the amygdala. Bdnf expression throughout the basolateral amygdala (BLA), basomedial amygdala (BMA), and the medial amygdala (MeA) in (A) WT and (B) Mecp2 CKO mice. Bdnf expression in (C) WT and (D) Mecp2 CKO PVN. Bdnf expression in (E) WT VMH, and (F) Mecp2 CKO VMH. The outlined area highlights the VMH. _Bdnf_-expressing neurons were counted on sections throughout the (G) PVN and (H) VMH. Values represent +/− SEM.
Figure 7
RNA in situ hybridization demonstrates that Mecp2 CKO mice display decreased expression of Crh in the PVN. Crh expression in representative sections of (A) WT and (B) Mecp2 CKO PVN.
Similar articles
- MeCP2 SUMOylation rescues Mecp2-mutant-induced behavioural deficits in a mouse model of Rett syndrome.
Tai DJ, Liu YC, Hsu WL, Ma YL, Cheng SJ, Liu SY, Lee EH. Tai DJ, et al. Nat Commun. 2016 Feb 4;7:10552. doi: 10.1038/ncomms10552. Nat Commun. 2016. PMID: 26842955 Free PMC article. - Cannabinoid type 1 receptors located on single-minded 1-expressing neurons control emotional behaviors.
Dubreucq S, Kambire S, Conforzi M, Metna-Laurent M, Cannich A, Soria-Gomez E, Richard E, Marsicano G, Chaouloff F. Dubreucq S, et al. Neuroscience. 2012 Mar 1;204:230-44. doi: 10.1016/j.neuroscience.2011.08.049. Epub 2011 Sep 3. Neuroscience. 2012. PMID: 21920410 - BRS3 in both MC4R- and SIM1-expressing neurons regulates energy homeostasis in mice.
Xiao C, Liu N, Province H, Piñol RA, Gavrilova O, Reitman ML. Xiao C, et al. Mol Metab. 2020 Jun;36:100969. doi: 10.1016/j.molmet.2020.02.012. Epub 2020 Feb 29. Mol Metab. 2020. PMID: 32229422 Free PMC article. - Exploring the possible link between MeCP2 and oxidative stress in Rett syndrome.
Filosa S, Pecorelli A, D'Esposito M, Valacchi G, Hajek J. Filosa S, et al. Free Radic Biol Med. 2015 Nov;88(Pt A):81-90. doi: 10.1016/j.freeradbiomed.2015.04.019. Epub 2015 May 8. Free Radic Biol Med. 2015. PMID: 25960047 Review. - The role of MeCP2 in the brain.
Guy J, Cheval H, Selfridge J, Bird A. Guy J, et al. Annu Rev Cell Dev Biol. 2011;27:631-52. doi: 10.1146/annurev-cellbio-092910-154121. Epub 2011 Jun 29. Annu Rev Cell Dev Biol. 2011. PMID: 21721946 Review.
Cited by
- Anxiety-related mechanisms of respiratory dysfunction in a mouse model of Rett syndrome.
Ren J, Ding X, Funk GD, Greer JJ. Ren J, et al. J Neurosci. 2012 Nov 28;32(48):17230-40. doi: 10.1523/JNEUROSCI.2951-12.2012. J Neurosci. 2012. PMID: 23197715 Free PMC article. - Restoration of Mecp2 expression in GABAergic neurons is sufficient to rescue multiple disease features in a mouse model of Rett syndrome.
Ure K, Lu H, Wang W, Ito-Ishida A, Wu Z, He LJ, Sztainberg Y, Chen W, Tang J, Zoghbi HY. Ure K, et al. Elife. 2016 Jun 21;5:e14198. doi: 10.7554/eLife.14198. Elife. 2016. PMID: 27328321 Free PMC article. - Loss of MeCP2 in aminergic neurons causes cell-autonomous defects in neurotransmitter synthesis and specific behavioral abnormalities.
Samaco RC, Mandel-Brehm C, Chao HT, Ward CS, Fyffe-Maricich SL, Ren J, Hyland K, Thaller C, Maricich SM, Humphreys P, Greer JJ, Percy A, Glaze DG, Zoghbi HY, Neul JL. Samaco RC, et al. Proc Natl Acad Sci U S A. 2009 Dec 22;106(51):21966-71. doi: 10.1073/pnas.0912257106. Epub 2009 Dec 9. Proc Natl Acad Sci U S A. 2009. PMID: 20007372 Free PMC article. - Regulation of Brain DNA Methylation Factors and of the Orexinergic System by Cocaine and Food Self-Administration.
Saad L, Sartori M, Pol Bodetto S, Romieu P, Kalsbeek A, Zwiller J, Anglard P. Saad L, et al. Mol Neurobiol. 2019 Aug;56(8):5315-5331. doi: 10.1007/s12035-018-1453-6. Epub 2019 Jan 2. Mol Neurobiol. 2019. PMID: 30603957 - High-fat diet accelerates extreme obesity with hyperphagia in female heterozygous Mecp2-null mice.
Fukuhara S, Nakajima H, Sugimoto S, Kodo K, Shigehara K, Morimoto H, Tsuma Y, Moroto M, Mori J, Kosaka K, Morimoto M, Hosoi H. Fukuhara S, et al. PLoS One. 2019 Jan 4;14(1):e0210184. doi: 10.1371/journal.pone.0210184. eCollection 2019. PLoS One. 2019. PMID: 30608967 Free PMC article.
References
- Axelrod FB, Chelimsky GG, Weese-Mayer DE. Pediatric autonomic disorders. Pediatrics. 2006;118:309–321. - PubMed
- Balthasar N, Dalgaard LT, Lee CE, Yu J, Funahashi H, Williams T, Ferreira M, Tang V, McGovern RA, Kenny CD, et al. Divergence of melanocortin pathways in the control of food intake and energy expenditure. Cell. 2005;123:493–505. - PubMed
- Bourin M, Hascoet M. The mouse light/dark box test. Eur J Pharmacol. 2003;463:55–65. - PubMed
- Carson JP, Eichele G, Chiu W. A method for automated detection of gene expression required for the establishment of a digital transcriptome-wide gene expression atlas. Journal of Microscopy. 2005;217:275–281. - PubMed
- Carson JP, Thaller C, Eichele G. A transcriptome atlas of the mouse brain at cellular resolution. Curr Opin Neurobiol. 2002;12:562–565. - PubMed
Publication types
MeSH terms
Substances
Grants and funding
- P30 HD024064-20/HD/NICHD NIH HHS/United States
- R01 NS057819-03/NS/NINDS NIH HHS/United States
- HD024064/HD/NICHD NIH HHS/United States
- R01 NS057819/NS/NINDS NIH HHS/United States
- AS1622/AS/Autism Speaks/United States
- K08 NS052240-02/NS/NINDS NIH HHS/United States
- HHMI/Howard Hughes Medical Institute/United States
- K08 NS052240-01/NS/NINDS NIH HHS/United States
- K08 NS052240-05/NS/NINDS NIH HHS/United States
- NS057819/NS/NINDS NIH HHS/United States
- K08 NS052240-04/NS/NINDS NIH HHS/United States
- P30 HD024064/HD/NICHD NIH HHS/United States
- K08 NS052240-03/NS/NINDS NIH HHS/United States
- K08 NS052240/NS/NINDS NIH HHS/United States
LinkOut - more resources
Full Text Sources
Other Literature Sources
Medical
Molecular Biology Databases


