Unique ERalpha cistromes control cell type-specific gene regulation - PubMed (original) (raw)
Unique ERalpha cistromes control cell type-specific gene regulation
Susan A Krum et al. Mol Endocrinol. 2008 Nov.
Abstract
Estrogens play an important role in normal physiology and in a variety of pathological states involving diverse tissues including breast and bone. The mechanism by which estrogens exert cell type- and disease-specific effects, however, remains to be explained. We have compared the gene expression profile of the MCF7 breast cancer cell line with that of the osteoblast-like cell line U2OS-ERalpha by expression microarrays. We find that fewer than 10% of the 17beta-estradiol (E2)-regulated genes are common to both cell types. We have validated this in primary calvarial osteoblasts. To dissect the mechanism underlying the cell type-specific E2 regulation of gene expression in MCF7 and U2OS-ERalpha cells, we compared the ERalpha binding sites on DNA in the two cell types by performing chromatin immunoprecipitation (ChIP) on genomic tiling arrays (ChIP-on-chip). Consistent with the distinct patterns of E2-regulated gene expression in these two cell lines, we find that the vast majority of ERalpha binding sites are also cell type specific and correlate both in position and number with cell type-specific gene regulation. Interestingly, although the forkhead factor FoxA1 plays a critical role in defining the ERalpha cistrome in MCF7 cells, it is not expressed in U2OS-ERalpha cells, and forkhead motifs are not enriched in the ERalpha cistrome in these cells. Finally, the ERalpha cistromes are correlated with cell type-specific epigenetic histone modifications. These results support a model for the cell type-specific action of E2 being driven primarily through specific ERalpha occupancy of epigenetically marked cis-regulatory regions of target genes.
Figures
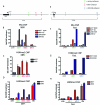
Figure 1
ERα-Mediated Gene Expression in Different Cell Types A, Venn diagram showing the number of genes regulated by 10 n
m
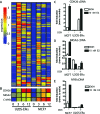
E2 for 3 h in MCF7 and U2OS-ERα cells. B, Cluster analysis of all of the genes up-regulated in U2OS-ERα cells at 3 h. Each column represents a time point (0, 3, 6, or 12 h) in U2OS-ERα or MCF7 cells and contains all of the genes up-regulated in U2OS-ERα cells at 3 h. Groups I–IV are described in the text. C–H, U2OS-ERα and MCF7 cells were deprived of E2 for 3 d in phenol red-free medium containing 5% CDT-FBS. U2OS-ERα cells were either treated with (to induce ERα) or without DOX for 24 h. They were then treated with 10 n
m
E2 for 3 h, and RNA was obtained. GPR30, FasL, NFATc1, c-myc, XBP1, and c-fos cDNA were analyzed by quantitative PCR. Error bars for all parts represent mean ± 1
sd
.
Figure 2
Common E2-Regulated Genes in MCF7 and U2OS-ERα Cells A, Cluster analysis of all of the genes up-regulated in both MCF7 and U2OS-ERα cells at 3 h. B, Representation of array data for CDH26, NR5A2, and MYB. C–E, U2OS-ERα and MCF7 cells were deprived of E2 for 3 d in phenol red-free medium containing 5% CDT-FBS. U2OS-ERα cells were either treated with (to induce ERα) or without DOX for 24 h. U2OS-ERα and MCF7 cells were treated with 10 n
m
E2 for 3 h, and RNA was obtained. CDH26, NR5A2, and MYB were analyzed by quantitative PCR. Error bars for all parts represent mean ± 1
sd
.
Figure 3
Novel E2 Targets in Bone A, U2OS-ERα cells were treated with 10 n
m
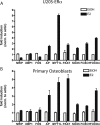
E2 for 3 h, and RNA was obtained. Quantitative PCR was performed in triplicate on cDNA from three independent experiments. B, Primary calvarial osteoblasts were treated with 10 n
m
E2 for 3 h, and RNA was obtained. Quantitative PCR was performed in triplicate on cDNA from three independent experiments. Error bars for all parts represent mean ± 1
sd
. AP, Alkaline phosphatase.
Figure 4
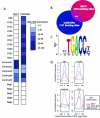
Comparison of the ERα Cistromes in U2OS-ERα Cells and MCF7 Cells A, Directed ChIP was performed on MCF7 and U2OS-ERα cells after 45 min E2 treatment. Quantitative PCR was performed on 10 ERα binding sites in U2OS-ERα cells, five common binding sites and five negative control sites. The 10 ERα binding sites are designated with a U, and the number of the binding site from the list of 1137 sites. The binding sites in both the MCF7 and the U2OS-ERα data sets are designated common. The five negative control sites (not found on either list) are designated Neg1–5. Data are presented as enrichment over background genomic DNA and are the average of three independent experiments. B, The number of ERα binding sites on chromosomes 1 and 6 in U2OS-ERα cells at a false discovery rate of 1% was compared with the number of ERα binding sites on chromosomes 1 and 6 in MCF7 cells under the same conditions. C, Identification of de novo enriched motifs within the U2OS-ERα ERα binding sites revealed a conical ERE half-site as the most enriched. D, Enrichment for the ERE, ERE half-site, forkhead, and activator protein-1 (AP-1) motifs in the center of the binding sites specific to MCF7 cells, U2OS-ERα cells, or a randomly generated data set. The occurrence of the motifs (N motifs) was normalized to the number of sites in each subset (N binding sites).
Figure 5
ERα Binding in U2OS-ERα Cells Best Predicts Genes Up-Regulated in U2OS-ERα Cells A, The genes up-regulated or down-regulated at 3 and 12 h (or not regulated, NR) in U2OS-ERα cells were analyzed for the percentage with a binding site in the gene or 10 kb upstream of the transcriptional start site. **, P < 0.0005 compared with nonregulated genes. B, The genes up-regulated (or not regulated, NR) in U2OS-ERα cells and MCF7 cells were analyzed for the percentage with a binding site in the gene or 10 kb upstream of the transcriptional start site. *, P < 0.006 compared with nonregulated genes.
Figure 6
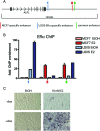
ERα Regulates Alkaline Phosphatase Transcription in U2OS-ERα Cells A, Diagram of the ALPL locus. B, U2OS-ERα and MCF7 cells were treated with 10 n
m
E2 for 45 min, and ChIP was performed with an antibody to ERα. Quantitative PCR was performed with primers to the ALPL enhancers. Error bars represent mean ± 1
sd
. C, U2OS-ERα cells were either treated with (to induce ERα) or without DOX for 24 h. The cells were then treated with 10 n
m
E2 for 24 h and stained for alkaline phosphatase.
Figure 7
Genes Regulated by E2 at 3 h Have a Higher Number of ERα Binding Sites A, Diagram of the PAX7 locus. B, U2OS-ERα and MCF7 cells were treated with 10 n
m
E2 for 45 min, and ChIP was performed with an antibody to ERα. Quantitative PCR was performed with primers to the PAX7 enhancer and promoter. Error bars represent mean ± 1
sd
. C, Each of the genes up-regulated at 3 h by E2 in U2OS-ERα and MCF7 cells or nonregulated genes in U2OS-ERα cells was analyzed for the number of ERα binding sites in the gene and 10 kb upstream of the gene. A randomly generated set of binding sites was also compared with the genes up-regulated at 3 h in U2OS-ERα and MCF7 cells or nonregulated genes in U2OS-ERα cells.
Figure 8
Histones in U2OS-ERα and MCF7 Cells Are Differentially Methylated A, Diagram of the XBP1 locus with the three enhancers shown as vertical lines. B, U2OS-ERα and MCF7 cells were treated with 10 n
m
E2 for 45 min, and ChIP was performed with an antibody to ERα. Quantitative PCR was performed with primers to the XBP1 enhancers and promoter. C, ChIP was performed as in B but with an antibody to H3K4me2. D, ChIP was performed as in B but with an antibody to H3K9me2. Quantitative PCR was performed with primers to the XBP1 enhancers, actin promoter, and hemoglobin (HBB) promoter. E, Diagram of the FasL locus with the two enhancers. F, ChIP was performed as in B. Quantitative PCR was performed with primers to the FasL enhancers and promoter. G, ChIP was performed as in B but with an antibody to H3K4me2. Quantitative PCR was performed with primers to the FasL enhancers and promoter. H, ChIP was performed as in B but with an antibody to H3K9me2. Quantitative PCR was performed with primers to the FasL enhancers, actin promoter, and hemoglobin (HBB) promoter. Error bars for all parts represent mean ± 1
sd
.
Similar articles
- Estrogen receptor alpha and beta heterodimers exert unique effects on estrogen- and tamoxifen-dependent gene expression in human U2OS osteosarcoma cells.
Monroe DG, Secreto FJ, Subramaniam M, Getz BJ, Khosla S, Spelsberg TC. Monroe DG, et al. Mol Endocrinol. 2005 Jun;19(6):1555-68. doi: 10.1210/me.2004-0381. Epub 2005 Mar 31. Mol Endocrinol. 2005. PMID: 15802376 - From the Cover: Location analysis of estrogen receptor alpha target promoters reveals that FOXA1 defines a domain of the estrogen response.
Laganière J, Deblois G, Lefebvre C, Bataille AR, Robert F, Giguère V. Laganière J, et al. Proc Natl Acad Sci U S A. 2005 Aug 16;102(33):11651-6. doi: 10.1073/pnas.0505575102. Epub 2005 Aug 8. Proc Natl Acad Sci U S A. 2005. PMID: 16087863 Free PMC article. - Novel estrogen receptor-alpha binding sites and estradiol target genes identified by chromatin immunoprecipitation cloning in breast cancer.
Lin Z, Reierstad S, Huang CC, Bulun SE. Lin Z, et al. Cancer Res. 2007 May 15;67(10):5017-24. doi: 10.1158/0008-5472.CAN-06-3696. Cancer Res. 2007. PMID: 17510434 - Cistromics of hormone-dependent cancer.
Lupien M, Brown M. Lupien M, et al. Endocr Relat Cancer. 2009 Jun;16(2):381-9. doi: 10.1677/ERC-09-0038. Epub 2009 Apr 15. Endocr Relat Cancer. 2009. PMID: 19369485 Review. - The Estrogen Receptor α-Cistrome Beyond Breast Cancer.
Droog M, Mensink M, Zwart W. Droog M, et al. Mol Endocrinol. 2016 Oct;30(10):1046-1058. doi: 10.1210/me.2016-1062. Epub 2016 Aug 4. Mol Endocrinol. 2016. PMID: 27489947 Free PMC article. Review.
Cited by
- The tri-nucleotide spacer sequence between estrogen response element half-sites is conserved and modulates ERalpha-mediated transcriptional responses.
Shu FJ, Sidell N, Yang D, Kallen CB. Shu FJ, et al. J Steroid Biochem Mol Biol. 2010 Jun;120(4-5):172-9. doi: 10.1016/j.jsbmb.2010.04.009. Epub 2010 Apr 18. J Steroid Biochem Mol Biol. 2010. PMID: 20403436 Free PMC article. - Corticosteroid Receptors in the Brain: Transcriptional Mechanisms for Specificity and Context-Dependent Effects.
Meijer OC, Buurstede JC, Schaaf MJM. Meijer OC, et al. Cell Mol Neurobiol. 2019 May;39(4):539-549. doi: 10.1007/s10571-018-0625-2. Epub 2018 Oct 5. Cell Mol Neurobiol. 2019. PMID: 30291573 Free PMC article. Review. - Regulation and Function of FOXC1 in Osteoblasts.
Suthon S, Lin J, Perkins RS, Miranda-Carboni GA, Krum SA. Suthon S, et al. J Dev Biol. 2023 Sep 19;11(3):38. doi: 10.3390/jdb11030038. J Dev Biol. 2023. PMID: 37754840 Free PMC article. - FOXA1: a transcription factor with parallel functions in development and cancer.
Bernardo GM, Keri RA. Bernardo GM, et al. Biosci Rep. 2012 Apr 1;32(2):113-30. doi: 10.1042/BSR20110046. Biosci Rep. 2012. PMID: 22115363 Free PMC article. Review. - Insights from genomic profiling of transcription factors.
Farnham PJ. Farnham PJ. Nat Rev Genet. 2009 Sep;10(9):605-16. doi: 10.1038/nrg2636. Epub 2009 Aug 11. Nat Rev Genet. 2009. PMID: 19668247 Free PMC article. Review.
References
- Yager JD, Davidson NE 2006 Estrogen carcinogenesis in breast cancer. N Engl J Med 354:270–282 - PubMed
- Bodine PV, Henderson RA, Green J, Aronow M, Owen T, Stein GS, Lian JB, Komm BS 1998 Estrogen receptor-α is developmentally regulated during osteoblast differentiation and contributes to selective responsiveness of gene expression. Endocrinology 139:2048–2057 - PubMed
- Simoncini T, Mannella P, Fornari L, Caruso A, Varone G, Genazzani AR 2004 Genomic and non-genomic effects of estrogens on endothelial cells. Steroids 69:537–542 - PubMed
- Castro-Rivera E, Samudio I, Safe S 2001 Estrogen regulation of cyclin D1 gene expression in ZR-75 breast cancer cells involves multiple enhancer elements. J Biol Chem 276:30853–30861 - PubMed
- Carroll JS, Brown M 2006 Estrogen receptor target gene: an evolving concept. Mol Endocrinol 20:1707–1714 - PubMed
Publication types
MeSH terms
Substances
LinkOut - more resources
Full Text Sources
Other Literature Sources

