Mind bomb 1 in the lymphopoietic niches is essential for T and marginal zone B cell development - PubMed (original) (raw)
Comparative Study
. 2008 Oct 27;205(11):2525-36.
doi: 10.1084/jem.20081344. Epub 2008 Sep 29.
Young-Woong Kim, Bon-Kyoung Koo, Hyun-Woo Jeong, Mi-Jeong Yoon, Ki-Jun Yoon, Dong-Jae Jun, Sun-Kyoung Im, Juhee Shin, Myoung-Phil Kong, Kyong-Tai Kim, Keejung Yoon, Young-Yun Kong
Affiliations
- PMID: 18824586
- PMCID: PMC2571928
- DOI: 10.1084/jem.20081344
Comparative Study
Mind bomb 1 in the lymphopoietic niches is essential for T and marginal zone B cell development
Ran Song et al. J Exp Med. 2008.
Abstract
Notch signaling regulates lineage decisions at multiple stages of lymphocyte development, and Notch activation requires the endocytosis of Notch ligands in the signal-sending cells. Four E3 ubiquitin ligases, Mind bomb (Mib) 1, Mib2, Neuralized (Neur) 1, and Neur2, regulate the Notch ligands to activate Notch signaling, but their roles in lymphocyte development have not been defined. We show that Mib1 regulates T and marginal zone B (MZB) cell development in the lymphopoietic niches. Inactivation of the Mib1 gene, but not the other E3 ligases, Mib2, Neur1, and Neur2, abrogated T and MZB cell development. Reciprocal bone marrow (BM) transplantation experiments revealed that Mib1 in the thymic and splenic niches is essential for T and MZB cell development. Interestingly, when BM cells from transgenic Notch reporter mice were transplanted into Mib1-null mice, the Notch signaling was abolished in the double-negative thymocytes. In addition, the endocytosis of Dll1 was impaired in the Mib1-null microenvironment. Moreover, the block in T cell development and the failure of Dll1 endocytosis were also observed in coculture system by Mib1 knockdown. Our study reveals that Mib1 is the essential E3 ligase in T and MZB cell development, through the regulation of Notch ligands in the thymic and splenic microenvironments.
Figures
Figure 1.
The expression of E3 ubiquitin ligases and the deletion of Mib1 in the lymphoid tissues. (A and B) The expression of E3 ligases in the thymus (A) and spleens (B). Total RNAs were prepared from the thymus and spleen (total) and nonhematopoietic (CD45−) and hematopoietic (CD45+) fractions sorted from collagenase-treated thymi and spleens. They were subjected to quantitative real-time RT-PCR using specific primers for Cd45, Mib1, Mib2, Neur1, and Neur2. Data are mean ± SD from triplicate experiments. The mean expression level of Mib1 mRNA in the total thymus and spleen was defined as 1 arbitrary unit, as compared with the expression levels of the E3 ubiquitin ligases. (C) Immunohistochemistry was performed on the cryosections from the MMTV-Cre;Mib1+/f and MMTV-Cre;Mib1f/f thymi with the anti-Mib1 antibody. Note that Mib1 expression (arrowheads) was reduced in the MMTV-Cre;Mib1f/f mice thymus. Bars, 5 μm. (D) Total protein extracts of the spleens from the MMTV-Cre;Mib1+/f and MMTV-Cre;Mib1f/f mice were immunoblotted with the anti-Mib1 antibody.
Figure 2.
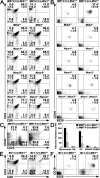
Impaired T cell development in the thymi of Mib1 conditional KO mice. (A and B) Thymocytes from ∼8–10-wk-old littermate controls (left) and the mutant (right) mice indicated were stained for CD4 and CD8 (A) and CD19 and B220 gated on CD4−CD8− DN thymocytes (B) and were analyzed by flow cytometry. Percentages of each population are indicated in the quadrants. Numbers are mean ± SD from 10 independent experiments. (C) Thymocytes from the indicated mice were analyzed by flow cytometry for the expression of CD44 and CD25 gated on CD4−CD8− DN thymocytes. Percentages indicated are mean ± SD from five independent experiments. (D) Absolute cell numbers for total thymocytes and thymocyte subsets of the MMTV-Cre;Mib1+/f and MMTV-Cre;Mib1f/f mice were calculated and are shown as histograms. The error bars represent mean ± SD from five independent experiments. *, P < 0.01. (E and F) The Mx1-Cre;Mib1+/f and Mx1-Cre;Mib1f/f mice were injected i.p. four times at 2-d intervals with 300 μg pIpC. At ∼8–14 wk after the final injection, the thymocytes were analyzed by flow cytometry for the expression of CD4 and CD8 (D) and CD19 and B220 (E) gated on CD4−CD8− DN thymocytes. Percentages indicated are mean ± SD from five independent experiments.
Figure 3.
Reduction of early T cell progenitors in the thymi of MMTV-Cre;Mib1f/f mice. (A) The thymocytes from the littermate control (left) and mutant (right) mice indicated were stained for CD4, CD8, CD44, CD25, CD24, and c-kit. ETPs were identified by CD24 and c-kit expression gated on CD4−CD8−CD25−CD44+ cells. Percentages indicated are mean ± SD from five independent experiments. (B) Leukocytes from the BM (top) and blood (bottom) of the MMTV-Cre;Mib1+/f and MMTV-Cre;Mib1f/f mice were stained for Sca-1 and c-kit gated on lineage-negative cells to identify LSK cells. Numbers indicate representatives of three independent experiments.
Figure 4.
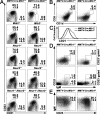
MZB cell defect in the MMTV-Cre;Mib1f/f mice. (A) The splenocytes from the indicated mice were analyzed by flow cytometry for the expression of CD21 and CD23 gated on B220+ cells. MZB and FOB cells were defined as CD21hiCD23lo/− and CD21intCD23hi, respectively. Percentages indicated are mean ± SD from 10 independent experiments. (B) The splenocytes from the MMTV-Cre;Mib1+/f (left) and MMTV-Cre;Mib1f/f (right) mice were stained for CD1d and CD9 gated on B220+ cells. Note the defective CD1dhiCD9hi MZB cells in the mutant mice. Percentages indicated are mean ± SD from 10 independent experiments. (C) FOB cells from the MMTV-Cre;Mib1+/f and MMTV-Cre;Mib1f/f mice were analyzed by flow cytometry for the expression of CD21. A representative of four independent experiments is shown. (D) The splenocytes were stained with antibodies against CD21, CD23, and IgM and were analyzed by flow cytometry for the expression of CD21 and IgM, gated on the CD23− splenocytes for T1 B cells, and gated on the CD23+ splenocytes for T2 B cells. Numbers indicate mean ± SD from five independent experiments. (E) The splenocytes from the indicated mice were analyzed by flow cytometry for the expression of CD23 and IgM gated on B220+AA4.1+ cells. The transitional T2 B cells were defined as CD23+IgMhi. Percentages indicated are mean ± SD from three independent experiments.
Figure 5.
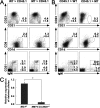
Regulation of T cell development by Mib1 in the thymic microenvironment. (A) The lethally irradiated CD45.1 mice were injected intravenously with BM cells from the 12–15-wk-old MMTV-Cre;Mib1+/f and MMTV-Cre;Mib1f/f mice. At 12 wk after transplantation, the thymocytes were analyzed by flow cytometry for the expression of CD4 and CD8 gated on the CD45.2+ populations (top), CD19 and B220 gated on the CD4−CD8− DN thymocytes (middle), and CD24 and c-kit gated on CD4−CD8−CD25−CD44+ cells (bottom). Numbers indicate mean ± SD from four independent experiments. (B) The lethally irradiated MMTV-Cre;Mib1+/f and MMTV-Cre;Mib1f/f mice were transplanted with CD45.1 BM cells. At 5–6 wk after reconstitution with CD45.1 BM cells, the thymocytes were stained for CD4 and CD8 (top) and B220 gated on the CD4−CD8− DN thymocytes (bottom). Numbers indicate mean ± SD from three independent experiments. (C) Genomic DNA was prepared from the CD45− cells sorted from thymi. Quantitative real-time PCR was performed to analyze the Mib1 deletion using deleted allele-specific primers. Expression of nondeleted allele served as a control for relative quantification. Data are mean ± SD from triplicate experiments. *, P < 0.01.
Figure 6.
Regulation of MZB cell development by Mib1 in the splenic microenvironment. (A) The lethally irradiated CD45.1 mice were injected i.v. with BM cells from the 12–15-wk-old MMTV-Cre;Mib1+/f (left) and MMTV-Cre;Mib1f/f (right) mice. At 12 wk after transplantation, the splenocytes were stained for the expression of CD21 and CD23 gated on the CD45.1+B220+ cells (top), CD1d and CD9 gated on the CD45.1+B220+ cells (middle), and CD21 and IgM gated on CD45.1+CD23− cells (bottom). Percentages indicated are mean ± SD from five independent experiments. (B) The lethally irradiated MMTV-Cre;Mib1+/f (left) and MMTV-Cre;Mib1f/f (right) mice (7–9 wk old) were transplanted with CD45.1 BM cells. At 5–6 wk after reconstitution with CD45.1 BM cells, the splenocytes were analyzed as in A. Percentages indicated are mean ± SD from five independent experiments. (C) Genomic DNA was prepared from the CD45− cells sorted from spleens and was analyzed by quantitative real-time PCR with deleted allele-specific primers. Data are mean ± SD from triplicate experiments. *, P < 0.0001.
Figure 7.
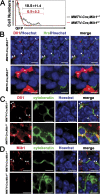
Notch signaling defect in the thymi of Mib1 conditional KO mice. (A) The lethally irradiated MMTV-Cre;Mib1+/f (black) and MMTV-Cre;Mib1f/f (red) mice (7–9 wk old) were injected i.v. with BM cells from the TNR mice (51). At 4 wk after transplantation, the thymocytes were analyzed by flow cytometry for GFP expression gated on the CD4−CD8− DN thymocytes. Percentages indicated are mean ± SD from three independent experiments. (B–D) The lethally irradiated MMTV-Cre;Mib1+/f and MMTV-Cre;Mib1f/f mice were transplanted with CD45.1 BM cells. 6 wk after transplantation, the thymi were fixed and cryosections were immunostained with anti-Dll1 (B and C, red), anti-Hrs (B, green), anti-cytokeratin (C and D, green), and anti-Mib1 (D, red) antibodies with HOECHST (blue). Note that Dll1 was colocalized with Hrs (B, arrowheads) in the MMTV-Cre;Mib1+/f thymus, whereas it accumulated in the cytokeratin-positive cortical epithelial cells of the MMTV-Cre;Mib1f/f thymus (B and C, asterisks). The arrowheads in C and D show the expression of Dll1 and Mib1, respectively. A representative of three independent experiments is shown. Bars, 5 μm.
Figure 8.
Block in T cell development at DN1 stage in knockdown Mib1 in OP9-DL1 cells. (A) Immunoblot of Mib1 protein in OP9-DL1 cells 36 h after microporation with control (ctrl) or Mib1 siRNA. Dll1 expression was not affected. (B) Control siRNA/OP9-DL1 or Mib1 siRNA/OP9-DL1 cells were cocultured with C2C12-Notch1 cells transfected with 8× WT CBF-Luc vectors. 24 h after coculture, luciferase activities were measured. Data are mean ± SD from triplicate experiments. *, P < 0.001. (C) Lin−Sca-1+c-Kit+ fetal liver (FL-LSK) or BM (BM-LSK) cells were prepared and cultured on control siRNA/OP9-DL1 or Mib1 siRNA/OP9-DL1 cells. Growing cells collected on days 5 or 7, respectively, were stained for CD44 and CD25 gated on CD4−CD8− DN cells and analyzed by flow cytometry. A representative of three independent experiments is shown. (D) C2C12-Notch1 cells were cocultured on control siRNA/OP9-DL1 or Mib1 siRNA/OP9-DL1 cells. After 12 h, the cells were stained with Dll1 antibody. Bars, 10 μm.
Similar articles
- An obligatory role of mind bomb-1 in notch signaling of mammalian development.
Koo BK, Yoon MJ, Yoon KJ, Im SK, Kim YY, Kim CH, Suh PG, Jan YN, Kong YY. Koo BK, et al. PLoS One. 2007 Nov 28;2(11):e1221. doi: 10.1371/journal.pone.0001221. PLoS One. 2007. PMID: 18043734 Free PMC article. - Neuralized-2 regulates a Notch ligand in cooperation with Mind bomb-1.
Song R, Koo BK, Yoon KJ, Yoon MJ, Yoo KW, Kim HT, Oh HJ, Kim YY, Han JK, Kim CH, Kong YY. Song R, et al. J Biol Chem. 2006 Nov 24;281(47):36391-400. doi: 10.1074/jbc.M606601200. Epub 2006 Sep 26. J Biol Chem. 2006. PMID: 17003037 - Mind bomb 1 is essential for generating functional Notch ligands to activate Notch.
Koo BK, Lim HS, Song R, Yoon MJ, Yoon KJ, Moon JS, Kim YW, Kwon MC, Yoo KW, Kong MP, Lee J, Chitnis AB, Kim CH, Kong YY. Koo BK, et al. Development. 2005 Aug;132(15):3459-70. doi: 10.1242/dev.01922. Epub 2005 Jul 6. Development. 2005. PMID: 16000382 - Structure and function of the Mind bomb E3 ligase in the context of Notch signal transduction.
Guo B, McMillan BJ, Blacklow SC. Guo B, et al. Curr Opin Struct Biol. 2016 Dec;41:38-45. doi: 10.1016/j.sbi.2016.05.012. Epub 2016 Jun 7. Curr Opin Struct Biol. 2016. PMID: 27285058 Free PMC article. Review. - Regulation of Notch signaling during T- and B-cell development by O-fucose glycans.
Stanley P, Guidos CJ. Stanley P, et al. Immunol Rev. 2009 Jul;230(1):201-15. doi: 10.1111/j.1600-065X.2009.00791.x. Immunol Rev. 2009. PMID: 19594638 Review.
Cited by
- Regulation of innate and adaptive immunity by Notch.
Radtke F, MacDonald HR, Tacchini-Cottier F. Radtke F, et al. Nat Rev Immunol. 2013 Jun;13(6):427-37. doi: 10.1038/nri3445. Epub 2013 May 13. Nat Rev Immunol. 2013. PMID: 23665520 Review. - Protein ubiquitination in T cell development.
Zhong T, Lei K, Lin X, Xie Z, Luo S, Zhou Z, Zhao B, Li X. Zhong T, et al. Front Immunol. 2022 Aug 4;13:941962. doi: 10.3389/fimmu.2022.941962. eCollection 2022. Front Immunol. 2022. PMID: 35990660 Free PMC article. Review. - POK/ZBTB proteins: an emerging family of proteins that regulate lymphoid development and function.
Lee SU, Maeda T. Lee SU, et al. Immunol Rev. 2012 May;247(1):107-19. doi: 10.1111/j.1600-065X.2012.01116.x. Immunol Rev. 2012. PMID: 22500835 Free PMC article. Review. - Ubiquitin enzymes in the regulation of immune responses.
Ebner P, Versteeg GA, Ikeda F. Ebner P, et al. Crit Rev Biochem Mol Biol. 2017 Aug;52(4):425-460. doi: 10.1080/10409238.2017.1325829. Epub 2017 May 19. Crit Rev Biochem Mol Biol. 2017. PMID: 28524749 Free PMC article. Review. - Role of Notch2 pathway in mature B cell malignancies.
Mesini N, Fiorcari S, Atene CG, Maffei R, Potenza L, Luppi M, Marasca R. Mesini N, et al. Front Oncol. 2023 Jan 4;12:1073672. doi: 10.3389/fonc.2022.1073672. eCollection 2022. Front Oncol. 2023. PMID: 36686759 Free PMC article. Review.
References
- Miller, J.F. 1961. Immunological function of the thymus. Lancet. 278:748–749. - PubMed
- Cantor, H., and I. Weissman. 1976. Development and function of subpopulations of thymocytes and T lymphocytes. Prog. Allergy. 20:1–64. - PubMed
- Stutman, O. 1978. Intrathymic and extrathymic T cell maturation. Immunol. Rev. 42:138–184. - PubMed
- Takahama, Y. 2006. Journey through the thymus: stromal guides for T-cell development and selection. Nat. Rev. Immunol. 6:127–135. - PubMed
- Ladi, E., X. Yin, T. Chtanova, and E.A. Robey. 2006. Thymic microenvironments for T cell differentiation and selection. Nat. Immunol. 7:338–343. - PubMed
Publication types
MeSH terms
Substances
LinkOut - more resources
Full Text Sources
Molecular Biology Databases
Miscellaneous


