DNA methylation changes in ovarian cancer are cumulative with disease progression and identify tumor stage - PubMed (original) (raw)
DNA methylation changes in ovarian cancer are cumulative with disease progression and identify tumor stage
George S Watts et al. BMC Med Genomics. 2008.
Abstract
Background: Hypermethylation of promoter CpG islands with associated loss of gene expression, and hypomethylation of CpG-rich repetitive elements that may destabilize the genome are common events in most, if not all, epithelial cancers.
Methods: The methylation of 6,502 CpG-rich sequences spanning the genome was analyzed in 137 ovarian samples (ten normal, 23 low malignant potential, 18 stage I, 16 stage II, 54 stage III, and 16 stage IV) ranging from normal tissue through to stage IV cancer using a sequence-validated human CpG island microarray. The microarray contained 5' promoter-associated CpG islands as well as CpG-rich satellite and Alu repetitive elements.
Results: Results showed a progressive de-evolution of normal CpG methylation patterns with disease progression; 659 CpG islands showed significant loss or gain of methylation. Satellite and Alu sequences were primarily associated with loss of methylation, while promoter CpG islands composed the majority of sequences with gains in methylation. Since the majority of ovarian tumors are late stage when diagnosed, we tested whether DNA methylation profiles could differentiate between normal and low malignant potential (LMP) compared to stage III ovarian samples. We developed a class predictor consisting of three CpG-rich sequences that was 100% sensitive and 89% specific when used to predict an independent set of normal and LMP samples versus stage III samples. Bisulfite sequencing confirmed the NKX-2-3 promoter CpG island was hypermethylated with disease progression. In addition, 5-aza-2'-deoxycytidine treatment of the ES2 and OVCAR ovarian cancer cell lines re-expressed NKX-2-3. Finally, we merged our CpG methylation results with previously published ovarian expression microarray data and identified correlated expression changes.
Conclusion: Our results show that changes in CpG methylation are cumulative with ovarian cancer progression in a sequence-type dependent manner, and that CpG island microarrays can rapidly discover novel genes affected by CpG methylation in clinical samples of ovarian cancer.
Figures
Figure 1
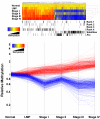
Differences in DNA methylation patterns across the genome distinguish ovarian tissues by stage (see Additional Files2and3for sample histopathology and the list of sequences used in clustering). a) The 659 CpG-rich clones with differential methylation between any two tumor stages were used in hierarchical clustering by Pearson correlation and average linkage. Each CpG-rich clone is represented by one bar and colored by their average methylation relative to the median of the ten normal samples; hypermethylation is shown in red and hypomethylation shown in blue. Horizontally aligned black bands mark the position of specific ranks of clones: Rank 1, the clone sequence lies within 0.5 kb of the transcription start of a known gene; Rank 2, the clone lies within 1 kb of transcription start; Rank 3, the clone lies within 2 kb of transcription start; Rank 4, the clone lies >2 kb from transcription start; Satellites, probes containing satellite repeats; Alu, probes of which the clones consist of >25% Alu sequence. b) The same 659 CpG-rich clones are graphed by tumor stage. Each CpG-rich clone is represented by one line. Lines are colored by their average methylation in Stage IV; blue indicates loss of methylation, and red indicates gain of methylation, relative to the median of the ten normal samples.
Figure 2
The optimal number of sequences to predict normal or LMP ovarian tissue from stage III ovarian tumor. Graph of misclassification rate for each class (normal/LMP tissue or stage III ovarian tumor) as a function of the threshold value in the PAM algorithm. As the threshold parameter increases, the number of sequences in the classifier decreases. The optimal point was reached at a threshold value of 6.26, or 3 sequences.
Figure 3
Performance of the 3-sequence classifier during cross-validation. The probability of each sample belonging to one class (normal or LMP tissue, red; stage III ovarian tumor, green) is shown on the y-axis for each of the 43 samples used to develop the 3-sequence classifier. One normal sample and one stage III ovarian tumor were misclassified resulting in a misclassification rate of 5%.
Figure 4
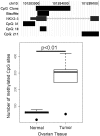
Confirmation of increased methylation at a NKX2-3 gene CpG island in ovarian tumor by bisulfite sequencing. a) Representation the 5' NKZ2-3 gene region showing the chromosomal location, associated CpG islands, region covered by the clone on the CGI array, region that was bisulfite sequenced, and the NKX2-3 gene itself. For the row labeled NKX2.3, the 5' untranslated region is indicated by the thin bar, the first and second exons are shown as thick bars, and the first intron is indicated by a thin line with overlaid arrow heads. b) Boxplot of the bisulfite sequencing results. The total number of methylated CpG sites in 47 clones from each of ten samples were averaged and plotted. The p-value for significance between the two means is shown (unpaired Welch's t-test).
Figure 5
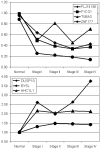
Expression of genes with altered expression and CpG island methylation across ovarian cancer progression. a) Expression profile of genes with increased CpG island methylation. b) Expression profile of genes with decreased CpG island methylation. Expression is graphed relative to the median of 4 normal samples and shown for all four stages of ovarian cancer.
Similar articles
- Aberrant methylation and silencing of ARHI, an imprinted tumor suppressor gene in which the function is lost in breast cancers.
Yuan J, Luo RZ, Fujii S, Wang L, Hu W, Andreeff M, Pan Y, Kadota M, Oshimura M, Sahin AA, Issa JP, Bast RC Jr, Yu Y. Yuan J, et al. Cancer Res. 2003 Jul 15;63(14):4174-80. Cancer Res. 2003. PMID: 12874023 - Hypomethylation of the synuclein gamma gene CpG island promotes its aberrant expression in breast carcinoma and ovarian carcinoma.
Gupta A, Godwin AK, Vanderveer L, Lu A, Liu J. Gupta A, et al. Cancer Res. 2003 Feb 1;63(3):664-73. Cancer Res. 2003. PMID: 12566312 - Hypermethylation of CpG island loci and hypomethylation of LINE-1 and Alu repeats in prostate adenocarcinoma and their relationship to clinicopathological features.
Cho NY, Kim BH, Choi M, Yoo EJ, Moon KC, Cho YM, Kim D, Kang GH. Cho NY, et al. J Pathol. 2007 Feb;211(3):269-77. doi: 10.1002/path.2106. J Pathol. 2007. PMID: 17139617 - Demethylation of the MCJ gene in stage III/IV epithelial ovarian cancer and response to chemotherapy.
Strathdee G, Vass JK, Oien KA, Siddiqui N, Curto-Garcia J, Brown R. Strathdee G, et al. Gynecol Oncol. 2005 Jun;97(3):898-903. doi: 10.1016/j.ygyno.2005.03.023. Gynecol Oncol. 2005. PMID: 15894365 - An Overview of DNA Methylation Indicators for the Course of Oral Precancer.
Wang W, Li W, Zhang H. Wang W, et al. Appl Bionics Biomech. 2022 Aug 26;2022:6468773. doi: 10.1155/2022/6468773. eCollection 2022. Appl Bionics Biomech. 2022. PMID: 36060560 Free PMC article. Retracted. Review.
Cited by
- Epigenomic analysis of Alu repeats in human ependymomas.
Xie H, Wang M, Bonaldo Mde F, Rajaram V, Stellpflug W, Smith C, Arndt K, Goldman S, Tomita T, Soares MB. Xie H, et al. Proc Natl Acad Sci U S A. 2010 Apr 13;107(15):6952-7. doi: 10.1073/pnas.0913836107. Epub 2010 Mar 29. Proc Natl Acad Sci U S A. 2010. PMID: 20351280 Free PMC article. - Mediation analysis of alcohol consumption, DNA methylation, and epithelial ovarian cancer.
Wu D, Yang H, Winham SJ, Natanzon Y, Koestler DC, Luo T, Fridley BL, Goode EL, Zhang Y, Cui Y. Wu D, et al. J Hum Genet. 2018 Mar;63(3):339-348. doi: 10.1038/s10038-017-0385-8. Epub 2018 Jan 10. J Hum Genet. 2018. PMID: 29321518 Free PMC article. - Estrogen receptor promoter methylation predicts survival in low-grade ovarian carcinoma patients.
Kirn V, Shi R, Heublein S, Knabl J, Guenthner-Biller M, Andergassen U, Fridrich C, Malter W, Harder J, Friese K, Mayr D, Jeschke U. Kirn V, et al. J Cancer Res Clin Oncol. 2014 Oct;140(10):1681-7. doi: 10.1007/s00432-014-1729-9. Epub 2014 Jun 8. J Cancer Res Clin Oncol. 2014. PMID: 24908329 - Biology-driven therapy advances in high-grade serous ovarian cancer.
Wang Y, Duval AJ, Adli M, Matei D. Wang Y, et al. J Clin Invest. 2024 Jan 2;134(1):e174013. doi: 10.1172/JCI174013. J Clin Invest. 2024. PMID: 38165032 Free PMC article. Review. - Arsenicals produce stable progressive changes in DNA methylation patterns that are linked to malignant transformation of immortalized urothelial cells.
Jensen TJ, Novak P, Wnek SM, Gandolfi AJ, Futscher BW. Jensen TJ, et al. Toxicol Appl Pharmacol. 2009 Dec 1;241(2):221-9. doi: 10.1016/j.taap.2009.08.019. Epub 2009 Aug 28. Toxicol Appl Pharmacol. 2009. PMID: 19716837 Free PMC article.
References
- American Cancer Society . Cancer facts & figures. Atlanta, GA: The Society; 2007.
- Jones PA, Baylin SB. The fundamental role of epigenetic events in cancer. Nat Rev Genet. 2002;3:415–428. - PubMed
LinkOut - more resources
Full Text Sources
Other Literature Sources


