Cognitive impairment in Gdi1-deficient mice is associated with altered synaptic vesicle pools and short-term synaptic plasticity, and can be corrected by appropriate learning training - PubMed (original) (raw)
. 2009 Jan 1;18(1):105-17.
doi: 10.1093/hmg/ddn321. Epub 2008 Oct 1.
Pasqualina Farisello, Pietro Baldelli, Virginia Meskenaite, Marco Milanese, Matteo Vecellio, Sven Mühlemann, Hans Peter Lipp, Giambattista Bonanno, Fabio Benfenati, Daniela Toniolo, Patrizia D'Adamo
Affiliations
- PMID: 18829665
- PMCID: PMC3298866
- DOI: 10.1093/hmg/ddn321
Cognitive impairment in Gdi1-deficient mice is associated with altered synaptic vesicle pools and short-term synaptic plasticity, and can be corrected by appropriate learning training
Veronica Bianchi et al. Hum Mol Genet. 2009.
Abstract
The GDI1 gene, responsible in human for X-linked non-specific mental retardation, encodes alphaGDI, a regulatory protein common to all GTPases of the Rab family. Its alteration, leading to membrane accumulation of different Rab GTPases, may affect multiple steps in neuronal intracellular traffic. Using electron microscopy and electrophysiology, we now report that lack of alphaGDI impairs several steps in synaptic vesicle (SV) biogenesis and recycling in the hippocampus. Alteration of the SV reserve pool (RP) and a 50% reduction in the total number of SV in adult synapses may be dependent on a defective endosomal-dependent recycling and may lead to the observed alterations in short-term plasticity. As predicted by the synaptic characteristics of the mutant mice, the short-term memory deficit, observed when using fear-conditioning protocols with short intervals between trials, disappeared when the Gdi1 mutants were allowed to have longer intervals between sessions. Likewise, previously observed deficits in radial maze learning could be corrected by providing less challenging pre-training. This implies that an intact RP of SVs is necessary for memory processing under challenging conditions in mice. The possibility to correct the learning deficit in mice may have clinical implication for future studies in human.
Figures
Figure 1.
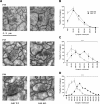
Altered distribution of SV density during synaptogenesis in hippocampal CA1 synapses of Gdi1 mutant mice. (A) Representative electron micrograph of synaptic contacts in the stratum radiatum of the CA1 region of the hippocampus from WT mice (left) and Gdi1 KO mice (right) at post-natal developmental stages indicated. Note the progressive depletion of SVs far away from active presynaptic zone of KO axon terminals over post-natal development. Bar, 0.5 µm. (B–D) Distributions of SVs density (SV number/μm2) per synapses of the stratum radiatum of the CA1 region of the hippocampus. The values of SV density were divided into bins of 50 SVs/μm2 and the mean number (±SEM) of sampled axon terminals falling into each bin were plotted as histogram profiles for WT and Gdi1 KO mice. Data are the result obtained from the analysis of 25 EM images randomly sampled for each animal at the different developmental stages. (B) P10 WT (n = 3; 241 synapses) and KO (n = 3; 272 synapses); (C) P23 WT (n = 3; 280 synapses) and KO (n = 3; 278 synapses); (D) P90 WT (n = 4; 342 synapses) and KO (n = 4; 357 synapses). ***P < 0.001, Mann–Wihitney _U_-test KO versus WT.
Figure 2.
Gdi1 mutant mice showed altered SV reserve pool. (A) Distribution of absolute number of SVs (means ± SEM) located within successive 50 nm thick shells from the AZ was calculated, by using the Excel macro. The analysis was done from 342 synaptic terminals of P90 WT (n = 4) and 357 synaptic terminal Gdi1 KO (n = 4) mice in CA1 region of the hippocampus. ***P < 0.001, Mann–Whitney _U_-test KO versus WT, for the intervals between 250 and 550 nm. (B) Manually counting of docked SVs from 342 synaptic terminal of P90 WT (n = 4) and 357 synaptic terminal Gdi1 KO (n = 4) mice hippocampus and plotted as means (±SEM).
Figure 3.
Analysis of SV and Rab proteins in nerve terminal fractions of wild-type and Gdi1 mutant mice. Crude SV fractions (LP2) and synaptosol (LS2) prepared from total brain of WT (n = 3) and Gdi1 KO (n = 3) P90 mice were analyzed by SDS-PAGE and immunoblotting. A battery of antibodies (listed in
Supplementary Material, Table S1
) against SV proteins, Rab3a interacting proteins, exo- and endocytosis markers and Rab proteins, and ERK1,2 to normalize the total amount of proteins loaded, were used. A difference between genotypes was observed for Rab4 and Rab5 (LP2 fraction: Rab4: WT = 2.8 ± 1.19 and KO = 3.46 ± 1.95; Rab5: WT = 1.25 ± 0.7 and KO = 1.91 ± 0.97; LS2 fraction: Rab4: WT = 1.08 ± 0.2 and KO = 0.41 ± 0.06; Rab5: WT = 0.2 ± 0.14 and KO = 0.03 ± 0.03). VGLUT, vesicular glutamate transporter; VGAT, vesicular GABA transporter; SV2, SV protein-2.
Figure 4.
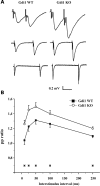
Gdi1 mutant mice show enhanced PPF. (A) fEPSPs recorded from the stratum radiatum of the hippocampal CA1 region of WT (left traces) and Gdi1 KO (right traces) mice in response to paired stimuli delivered to the Schaffer collateral commissural pathway at 10 (top traces), 50 (middle traces) and 250 (bottom traces) ms interstimulus intervals (time scale: 10, 35, 125 ms) in the presence of 100 µM D-AP5 and 10 µM CGP. (B) Mean (±SEM) paired-pulse (PP) ratios of the second to the first fEPSP slope in WT (n = 12) and Gdi1 KO (n = 12) mice are plotted as a function of the interstimulus interval. PP ratios were significantly different between the two groups at all tested interstimulus intervals (*P < 0.05, unpaired Student’s _t_-test).
Figure 5.
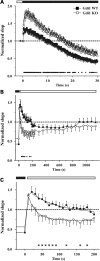
Depression and recovery from depression are altered in Gdi1 mutant neurons subjected to high-frequency stimulation. (A) fEPSP normalized relative to the baseline, was plotted as means ± SEM versus time during repetitive stimulation at 10 Hz for 30 s (n = 9 for both WT and KO slices). (B) The recovery from depression was analyzed by lowering the stimulation frequency from 10 to 0.1 Hz. The time-course of recovery was studied for 20 min after the end of the train in WT (n = 8) and KO mice (n = 7). (C) In an expanded time scale, a detail of the first 3 min of the recovery phase shown in (B) reveals that PTP lasted 2 min in WT slices, while it was rapidly lost and replaced by a phase of depression in KO slices. The time course of the PTP loss was fitted using the monoexponential function: y = yo + A_1 × exp(−_t/t) yielding the following values: t = 60.76 ± 10 and 19.36 ± 4.7 s. In all panels, the differences between the two genotypes were significant at the time points marked with asterisks (*P < 0.05, unpaired Student’s _t_-test).
Figure 6.
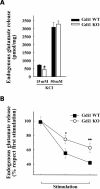
Glutamate release in response to KCl is impaired in Gdi1 KO synaptosomes. (A) Synaptosomes purified from adult WT (n = 12) and KO (n = 12) mice were depolarized with either 15 or 50 m
m
KCl and the stimulus-evoked overflow of glutamate was expressed in pmol of endogenous glutamate/mg protein. Bars are means ± SEM of six independent experiments. *P < 0.05, Student’s _t_-test KO versus WT synaptosomes. (B) KCl evokes release of glutamate during repetitive stimulation. Synaptosomes were stimulated with three sequential pulses of 15 m
m
KCl for 90 s administered at interpulse intervals of 9 min and the spontaneous or evoked release of endogenous glutamate was monitored. Glutamate overflow evoked by each pulse, expressed in percent of the release evoked by the first stimulus, is plotted as means ± SEM for WT and KO synaptosomes (n = 6 independent experiments run in triplicate). *P < 0.05; **P < 0.01; unpaired Student’s _t_-test KO versus the respective release value in WT synaptosomes.
Figure 7.
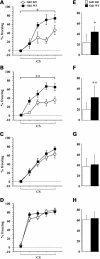
Gdi1 mutant mice learn normally in trace fear conditioning with spaced trials protocols. Gdi1 KO and WT mice were subjected to trace fear-conditioning training (A–D) by using four different ITI. (A) KO (n = 6) and WT (n = 7) animals, ITI=15 min; (B) KO (n = 17) and WT (n = 18) animals, ITI=26 min; (C) KO (n = 17) and WT (n = 17) animals, ITI = 37 min; (D) KO (n = 16) and WT (n = 15) animals, ITI = 60 min. (A–D) average percentage of freezing during bins of 15 s CS presentation, during the training session; (E–H) average percentage of freezing during 2 min memory test for context 24 h after training. Data in the plots represent the mean percentage of freezing (±SEM) for WT and Gdi1 KO mice. *P < 0.05; **P < 0.01; ANOVA KO versus WT.
Figure 8.
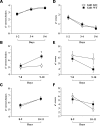
Gdi1 mutant mice display a normal working memory in the eight-arms radial maze task when memory processing is facilitated. Gdi1 KO and WT mice were tested in the radial maze test as described in Materials and Methods. (A–C) Learning performance (means ± SEM) is expressed as the mean number of correct arm choices before the first error. (D–F) Mean number of errors (±SEM) until eight correct choices were made. (A and D) Four-arm radial maze (WT = 35 and KO = 37); (B and E) eight-arm radial maze tested 24 h after the four-arm radial maze (WT = 20 and KO = 22); (C and F) Eight-arm radial maze tested 48 h after the four-arm radial maze (WT = 15 and KO = 15). *P < 0.05; ANOVA KO versus WT.
Similar articles
- Forebrain deletion of αGDI in adult mice worsens the pre-synaptic deficit at cortico-lateral amygdala synaptic connections.
Bianchi V, Gambino F, Muzio L, Toniolo D, Humeau Y, D'Adamo P. Bianchi V, et al. PLoS One. 2012;7(1):e29763. doi: 10.1371/journal.pone.0029763. Epub 2012 Jan 23. PLoS One. 2012. PMID: 22291894 Free PMC article. - Altered fronto-striatal functions in the Gdi1-null mouse model of X-linked Intellectual Disability.
Morè L, Künnecke B, Yekhlef L, Bruns A, Marte A, Fedele E, Bianchi V, Taverna S, Gatti S, D'Adamo P. Morè L, et al. Neuroscience. 2017 Mar 6;344:346-359. doi: 10.1016/j.neuroscience.2016.12.043. Epub 2017 Jan 3. Neuroscience. 2017. PMID: 28057534 Free PMC article. - X-linked mental retardation: focus on synaptic function and plasticity.
Humeau Y, Gambino F, Chelly J, Vitale N. Humeau Y, et al. J Neurochem. 2009 Apr;109(1):1-14. doi: 10.1111/j.1471-4159.2009.05881.x. Epub 2009 Jan 13. J Neurochem. 2009. PMID: 19183273 Review. - Synaptic vesicle pools and plasticity of synaptic transmission at the Drosophila synapse.
Kidokoro Y, Kuromi H, Delgado R, Maureira C, Oliva C, Labarca P. Kidokoro Y, et al. Brain Res Brain Res Rev. 2004 Dec;47(1-3):18-32. doi: 10.1016/j.brainresrev.2004.05.004. Brain Res Brain Res Rev. 2004. PMID: 15572160 Review.
Cited by
- Damaged mitochondria coincide with presynaptic vesicle loss and abnormalities in alzheimer's disease brain.
Wang W, Zhao F, Lu Y, Siedlak SL, Fujioka H, Feng H, Perry G, Zhu X. Wang W, et al. Acta Neuropathol Commun. 2023 Mar 31;11(1):54. doi: 10.1186/s40478-023-01552-7. Acta Neuropathol Commun. 2023. PMID: 37004141 Free PMC article. - Dynamin1 concentration in the prefrontal cortex is associated with cognitive impairment in Lewy body dementia.
Vallortigara J, Rangarajan S, Whitfield D, Alghamdi A, Howlett D, Hortobágyi T, Johnson M, Attems J, Ballard C, Thomas A, O'Brien J, Aarsland D, Francis P. Vallortigara J, et al. F1000Res. 2014 May 13;3:108. doi: 10.12688/f1000research.3786.1. eCollection 2014. F1000Res. 2014. PMID: 25671083 Free PMC article. - Inhibition of RhoA pathway rescues the endocytosis defects in Oligophrenin1 mouse model of mental retardation.
Khelfaoui M, Pavlowsky A, Powell AD, Valnegri P, Cheong KW, Blandin Y, Passafaro M, Jefferys JG, Chelly J, Billuart P. Khelfaoui M, et al. Hum Mol Genet. 2009 Jul 15;18(14):2575-83. doi: 10.1093/hmg/ddp189. Epub 2009 Apr 28. Hum Mol Genet. 2009. PMID: 19401298 Free PMC article. - Intellectual disability and epilepsy due to the K/L-mediated Xq28 duplication: Further evidence of a distinct, dosage-dependent phenotype.
Ward DI, Buckley BA, Leon E, Diaz J, Galegos MF, Hofherr S, Lewanda AF. Ward DI, et al. Am J Med Genet A. 2018 Mar;176(3):551-559. doi: 10.1002/ajmg.a.38524. Epub 2018 Jan 17. Am J Med Genet A. 2018. PMID: 29341460 Free PMC article. - Impaired αGDI Function in the X-Linked Intellectual Disability: The Impact on Astroglia Vesicle Dynamics.
Potokar M, Jorgačevski J, Lacovich V, Kreft M, Vardjan N, Bianchi V, D'Adamo P, Zorec R. Potokar M, et al. Mol Neurobiol. 2017 May;54(4):2458-2468. doi: 10.1007/s12035-016-9834-1. Epub 2016 Mar 12. Mol Neurobiol. 2017. PMID: 26971292
References
- Raymond F.L., Tarpey P. The genetics of mental retardation. Hum. Mol. Genet. 2006;15(Spec. 2):R110–R116. - PubMed
- Chiurazzi P., Schwartz C.E., Gecz J., Neri G. XLMR genes: update 2007. Eur. J. Hum. Genet. 2008;16:422–434. - PubMed
- Takai Y., Sasaki T., Matozaki T. Small GTP-binding proteins. Physiol. Rev. 2001;81:153–208. - PubMed
- Aligianis I.A., Johnson C.A., Gissen P., Chen D., Hampshire D., Hoffmann K., Maina E.N., Morgan N.V., Tee L., Morton J., et al. Mutations of the catalytic subunit of RAB3GAP cause Warburg Micro syndrome. Nat. Genet. 2005;37:221–223. - PubMed
Publication types
MeSH terms
Substances
LinkOut - more resources
Full Text Sources
Molecular Biology Databases
Research Materials
