CD4+CD25+ Tregs control the TRAIL-dependent cytotoxicity of tumor-infiltrating DCs in rodent models of colon cancer - PubMed (original) (raw)
. 2008 Nov;118(11):3751-61.
doi: 10.1172/JCI35890. Epub 2008 Oct 1.
Lionel Apetoh, Fanny Chalmin, Sylvain Ladoire, Grégoire Mignot, Pierre-Emmanuel Puig, Gregoire Lauvau, Laurence Zitvogel, François Martin, Bruno Chauffert, Hideo Yagita, Eric Solary, François Ghiringhelli
Affiliations
- PMID: 18830416
- PMCID: PMC2556241
- DOI: 10.1172/JCI35890
CD4+CD25+ Tregs control the TRAIL-dependent cytotoxicity of tumor-infiltrating DCs in rodent models of colon cancer
Stephan Roux et al. J Clin Invest. 2008 Nov.
Abstract
Tumors that progress do so via their ability to escape the antitumor immune response through several mechanisms, including developing ways to induce the differentiation and/or recruitment of CD4(+)CD25(+) Tregs. The Tregs, in turn, inhibit the cytotoxic function of T cells and NK cells, but whether they have an effect on the cytotoxic function of tumor-infiltrating DCs (TIDCs) has not been determined. Here we have shown, in 2 rodent models of colon cancer, that CD4(+)CD25(+) Tregs inhibit the ability of CD11b(+) TIDCs to mediate TNF-related apoptosis-inducing ligand-induced (TRAIL-induced) tumor cell death. In both models of cancer, combination treatment with Mycobacterium bovis Bacillus Calmette-Guérin (BCG), which activates the innate immune system via TLR2, TLR4, and TLR9, and cyclophosphamide (CTX), which depletes Tregs, eradicated the tumors. Further analysis revealed that the treatment led to a marked increase in the number of CD11b(+) TIDCs that killed the tumor cells via a TRAIL-dependent mechanism. Furthermore, acquisition of TRAIL expression by the CD11b(+) TIDCs was induced by BCG and dependent on signaling through TLR2, TLR4, and TLR9. In vivo transfer of Tregs abrogated the ability of BCG to induce CD11b(+) TIDCs to express TRAIL and thereby nullified the efficacy of the CTX-BCG treatment. Our data have therefore delineated what we believe to be a novel mechanism by which Tregs inhibit the antitumor immune response.
Figures
Figure 1. Synergistic antitumor effect of CTX administration followed by intratumoral BCG injections in 2 tumor models.
(A) Four groups of 7 wild-type BD-IX rats received a subcutaneous injection of 1 × 10⁶ syngeneic PROb tumor cells. Rats received 1 i.p. injection of CTX (30 mg/kg) on day 28 after tumor cell injection, or 2 intratumoral injections of BCG (8 × 10⁵ CFU) on day 35 and 42, or both. Control group received saline injections. Statistical comparison of mean tumor volume of the control group and treated groups was performed every 28 days, beginning on day 56. (B) Four groups of 8 wild-type BALB/c mice received a subcutaneous injection of 5 × 10⁵ syngeneic CT26 tumor cells. Mice received 1 i.p. injection of CTX (100 mg/kg body weight) on day 7 after tumor cell injection, or 2 intratumoral injections of BCG (8 × 10⁴ CFU) on day 9 and 14, or both. Untreated mice received saline injections. One experiment out of 3 is shown. Statistical comparison of mean tumor volume of the control group and treated groups was performed on days 15, 20, 25, and 30. *P < 0.05; †P < 0.01. Un, untreated.
Figure 2. CTX-BCG treatment induces tumor infiltration by myeloid DCs.
(A) MHC-II, CD11c, TCR, and CD163 immunohistochemical labeling of untreated PROb tumors or tumors obtained 7 days after the last BCG injection in animals treated by CTX-BCG. Original magnification, ×40. (B) FACS analysis of the recruitment of leukocyte subpopulations (indicated in horizontal line) into CT26 tumors 2 days after the last BCG injection. Fold increase was calculated by dividing the absolute number of cells found in treated animals by the absolute number of cells found in untreated animals. Values represent mean ± SEM. **P < 0.01.
Figure 3. Myeloid DCs are cytotoxic against tumor cells.
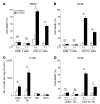
(A) For 48 hours, 5 × 10⁴ or 1 × 10⁴ TIDCs or CD8+ T cells isolated from tumors of untreated or CTX-BCG–treated rats were incubated with 1 × 10⁴ PROb cells. Cytotoxic effects on PROb cells were determined using a crystal violet assay. E/T, effector/target ratio. (B) For 48 hours, 5 × 10⁴ or 1 × 10⁴ TIDCs or CD8+ T cells isolated from CT26 tumors of untreated or CTX-BCG–treated mice were incubated with 1 × 10⁴ CT26 cells for 48 hours. Cytotoxic effect on CT26 cells was determined using a crystal violet assay. (C) FACS determination of the absolute number of DC subpopulations induced by the combined treatment in the CT26 model per mg of tumor. CD8α+ DC, CD8α+CD11c+MHC-II+CD45+; CD11b+ DC, CD11b+CD11c+MHC-II+CD45+; pDC, Gr1+B220+NK-p46–CD11cintCD45+; IKDC, Gr1–B220+NK–p46+CD11c+CD45+. (D) For 48 hours, 5 × 10⁴ or 1 × 10⁴ CD8α+ TIDCs or CD11b+ TIDCs isolated from untreated or CTX-BCG–treated mice were incubated with 1 × 10⁴ CT26 cells. Cytotoxic effect on the CT26 cells was determined using a crystal violet assay. For each experiment, values represent mean ± SEM. *P < 0.05.
Figure 5. BCG activated human Mo-DCs are cytotoxic against human cell lines in a TRAIL-dependent manner.
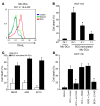
(A) FACS analysis of TRAIL expression on CD11c+ HLA-DR+ DCs derived from human CD14+ peripheral blood monocytes after overnight incubation with BCG (8 × 10⁵ CFU/ml) or PBS. (B) Mo-DCs were either untreated or cultured overnight with BCG and then incubated with 1 × 10⁴ HCT116 cells for 48 hours at various effector/target ratios. Cytotoxic effect on HCT116 cells was determined using a crystal violet assay. (C) Mo-DCs were incubated overnight in the absence or presence of 8 × 10⁵ CFU/ml of BCG. Then 5 × 10⁴ Mo-DCs were incubated with 1 × 10⁴ tumor cells (M45, M96, and BEUR melanomas) for 48 hours and tumor cell cytotoxicity was determined using a crystal violet assay. (D) BCG stimulated Mo-DC cytotoxicity against HCT116 cells was determined by a crystal violet assay in the presence of anti-TRAIL,
l
-NMMA, concanamycin A, and Z-VAD-fmk at a 5:1 effector/target cell ratio. Values from 1 experiment out of 2 represent mean ± SEM. *P < 0.05.
Figure 4. BCG endows DCs with killing capacities via TRAIL upregulation.
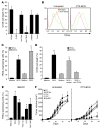
(A) For 48 hours, 5 × 10⁴ CD11b+ TIDCs isolated from CTX-BCG–treated mice were incubated with 1 × 10⁴ CT26 cells. In some wells, Z-VAD-fmk (Z-VAD), blocking anti–Fas ligand (FasL), anti-TRAIL mAbs,
l
-NMMA, or concanamycin A (CcmA) were added. CD11b+ TIDC cytotoxicity against CT26 cells was determined using a crystal violet assay. (B) FACS analysis of TRAIL expression on CD11b+ TIDCs (CD45+) that infiltrated untreated CT26 tumor and tumor treated with CTX-BCG. (C) CD11b+ TIDCs isolated from untreated CT26 tumors or BM-DCs were either untreated or cultured overnight with BCG (8 × 10⁵ CFU/ml). TRAIL expression was determined by FACS analysis on CD11c+ I-A/I-E+ gated cells and (D) 5 × 10⁴ CD11b+ TIDCs or BM-DCs were incubated with 1 × 10⁴ CT26 cells for 48 hours. A blocking anti-TRAIL mAb was also added to some of the wells containing BM-DCs activated by BCG. Cytotoxic effect on the CT26 cells was determined using a crystal violet assay. (E) BM-DCs were incubated overnight in the absence or presence of ligands for TLR2 (Pamv3CSK4 [Pam3]), TLR3 [Poly(I:C)], TLR4 (LPS), TLR9 (CpG ODN 1826 [CpG 1826]), or with BCG (8 × 10⁵ CFU/ml). TRAIL expression was determined by FACS analysis on CD11c+ I-A/I-E+ gated cells. (F) Wild-type, Myd88–/–, Tlr2–/–, Tlr4–/–, or wild-type mice treated with i.p. injections of TLR9 inhibitor ODN (IRS 954) every 3 days received a subcutaneous injection of 5 × 10⁵ CT26 tumor cells. In the same experiment, 2 groups of mice received either saline or the combined treatment. Data represent mean ± SEM. *P < 0.05.
Figure 6. Tregs are selectively killed by CTX and prevent TRAIL-dependent cytotoxicity of TIDCs.
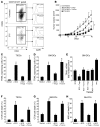
(A) FACS analysis of CD4+CD25+ (Treg) cells in the CD3+CD4+CD127– tumor-infiltrating T cell subsets. The percentage of Tregs and dead cells in tumors were determined by DAPI labeling 2 days after CTX injection. Numbers indicate the percentage of cells ± SD. (B) The day of the first BCG injection, 2 groups of mice were adoptively transferred with 1 × 10⁶ Tregs or 1 × 10⁶ CD4+CD25– (Tconv) cells (n = 5 in each group). (C) CD11b+ TIDCs from untreated CT26 tumor-bearing mice were incubated overnight with BCG and with Tregs or Tconvs at a ratio 1:1. TRAIL expression was determined by FACS analysis. (D) Same experiment as in C but using mouse BM-DCs instead of CD11b+ TIDCs. (E) Same experiment as in D but in some wells DCs were separated from T cells by a 0.4-μm Transwell insert. TRAIL and GAPDH mRNA levels were determined by quantitative RT-PCR on CD11c cells sorted by magnetic isolation. BM-DCs incubated with IFN-γ represent a positive control of TRAIL mRNA expression. Each value is expressed as fold increase from medium control after normalization with GAPDH. (F) CD11b+ TIDCs from untreated CT26 tumor-bearing animals were incubated overnight with BCG and with Tregs or Tconvs at a ratio 1:1. Then these cells (5 × 10⁴ cells) were cultured with 1 × 10⁴ CT26 cells for 48 hours. TIDC cytotoxicity on CT26 cells was determined using crystal violet staining. (G) Same experiment as in F but using mouse BM-DCs instead of CD11b+ TIDCs. (H) Same experiment as in F but using mouse Mo-DCs instead of CD11b+ TIDCs and M45 melanoma cells instead of CT26 cells. Values from 1 experiment out of 2 represent mean ± SEM. *P < 0.05.
Figure 7. Treg control TRAIL-mediated antitumor effect of CTX-BCG treatment in vivo.
(A) Unstimulated or overnight BCG stimulated BM-DCs (1–2 × 10⁶ cells) were injected intratumorally in nude mice 2, 4, 6, and 10 days after subcutaneous CT26 cell injection (n = 5 in each group). (B) FACS analysis of TRAIL expression in CD11b+ TIDCs (CD45+) from CT26 untreated or treated tumors. The day of the first BCG injection, 1 × 10⁶ Tregs, 1 × 10⁶ Tconvs, or 100 μl PBS were injected intravenously, and mice were killed 2 days after the second BCG intratumoral injection. Numbers indicate the percentage of cells ± SD. (C) Four groups of 5 BALB/c mice received a subcutaneous injection of 5 × 10⁵ CT26 tumor cells. Seven days later, mice received the combined treatment alone or in combination with intratumoral or i.p. injection of Z-VAD-fmk or anti-TRAIL mAb respectively. Untreated mice represent control group. For each experiment, animals were monitored twice a week for tumor volume. Values in A and C represent mean ± SEM. *P < 0.05.
_## Similar articles
* Dual effects of TRAIL in suppression of autoimmunity: the inhibition of Th1 cells and the promotion of regulatory T cells. Ikeda T, Hirata S, Fukushima S, Matsunaga Y, Ito T, Uchino M, Nishimura Y, Senju S. Ikeda T, et al. J Immunol. 2010 Nov 1;185(9):5259-67. doi: 10.4049/jimmunol.0902797. Epub 2010 Oct 4. J Immunol. 2010. PMID: 20921531 * CD4+CD25+ Treg derived from hepatocellular carcinoma mice inhibits tumor immunity. Chen X, Du Y, Huang Z. Chen X, et al. Immunol Lett. 2012 Nov-Dec;148(1):83-9. doi: 10.1016/j.imlet.2012.09.002. Epub 2012 Sep 19. Immunol Lett. 2012. PMID: 23000301 * Tumor-educated CD11bhighIalow regulatory dendritic cells suppress T cell response through arginase I. Liu Q, Zhang C, Sun A, Zheng Y, Wang L, Cao X. Liu Q, et al. J Immunol. 2009 May 15;182(10):6207-16. doi: 10.4049/jimmunol.0803926. J Immunol. 2009. PMID: 19414774 * Dendritic cells expand antigen-specific Foxp3+ CD25+ CD4+ regulatory T cells including suppressors of alloreactivity. Yamazaki S, Inaba K, Tarbell KV, Steinman RM. Yamazaki S, et al. Immunol Rev. 2006 Aug;212:314-29. doi: 10.1111/j.0105-2896.2006.00422.x. Immunol Rev. 2006. PMID: 16903923 Review. * Tregs and rethinking cancer immunotherapy. Curiel TJ. Curiel TJ. J Clin Invest. 2007 May;117(5):1167-74. doi: 10.1172/JCI31202. J Clin Invest. 2007. PMID: 17476346 Free PMC article. Review.
## Cited by
* Colorectal Cancer-Infiltrating Regulatory T Cells: Functional Heterogeneity, Metabolic Adaptation, and Therapeutic Targeting. Aristin Revilla S, Kranenburg O, Coffer PJ. Aristin Revilla S, et al. Front Immunol. 2022 Jul 8;13:903564. doi: 10.3389/fimmu.2022.903564. eCollection 2022. Front Immunol. 2022. PMID: 35874729 Free PMC article. Review. * Single cell characterization of blood and expanded regulatory T cells in autoimmune polyendocrine syndrome type 1. Sjøgren T, Islam S, Filippov I, Jebrzycka A, Sulen A, Breivik LE, Hellesen A, Jørgensen AP, Lima K, Tserel L, Kisand K, Peterson P, Ranki A, Husebye ES, Oftedal BE, Wolff ASB. Sjøgren T, et al. iScience. 2024 Mar 27;27(4):109610. doi: 10.1016/j.isci.2024.109610. eCollection 2024 Apr 19. iScience. 2024. PMID: 38632993 Free PMC article. * Low-dose metronomic cisplatin as an antiangiogenic and anti-inflammatory strategy for cancer. Kikuchi H, Maishi N, Yu L, Jia Z, Li C, Sato M, Takeda R, Ishizuka K, Hida Y, Shinohara N, Hida K. Kikuchi H, et al. Br J Cancer. 2024 Feb;130(2):336-345. doi: 10.1038/s41416-023-02498-2. Epub 2023 Dec 1. Br J Cancer. 2024. PMID: 38036665 Free PMC article. * The Role of TRAIL/DRs in the Modulation of Immune Cells and Responses. Sag D, Ayyildiz ZO, Gunalp S, Wingender G. Sag D, et al. Cancers (Basel). 2019 Sep 30;11(10):1469. doi: 10.3390/cancers11101469. Cancers (Basel). 2019. PMID: 31574961 Free PMC article. Review. * Lymphadenectomy exacerbates tumor growth while lymphadenectomy plus the adoptive transfer of autologous cytotoxic cells and low-dose cyclophosphamide induces regression of an established murine fibrosarcoma. Maglioco A, Machuca D, Mundiñano J, Cabrera G, Camicia G, Bruzzo J, Camerano G, Costa H, Ruggiero RA, Dran GI. Maglioco A, et al. Cancer Immunol Immunother. 2011 Mar;60(3):389-99. doi: 10.1007/s00262-010-0949-3. Epub 2010 Dec 14. Cancer Immunol Immunother. 2011. PMID: 21153814 Free PMC article.
## References
1. 1. Cai X.Y., et al. Dendritic cell infiltration and prognosis of human hepatocellular carcinoma. . J. Cancer Res. Clin. Oncol. 2006;132:293–301. doi: 10.1007/s00432-006-0075-y. - DOI - PubMed 2. 1. Troy A., Davidson P., Atkinson C., Hart D. Phenotypic characterisation of the dendritic cell infiltrate in prostate cancer. J. Urol. 1998;160:214–219. doi: 10.1016/S0022-5347(01)63093-3. - DOI - PubMed 3. 1. Nestle F.O., Burg G., Fah J., Wrone-Smith T., Nickoloff B.J. Human sunlight-induced basal-cell-carcinoma-associated dendritic cells are deficient in T cell co-stimulatory molecules and are impaired as antigen-presenting cells. Am. J. Pathol. 1997;150:641–651. - PMC - PubMed 4. 1. Bergeron A., El-Hage F., Kambouchner M., Lecossier D., Tazi A. Characterisation of dendritic cell subsets in lung cancer micro-environments. Eur. Respir. J. 2006;28:1170–1177. doi: 10.1183/09031936.06.00114205. - DOI - PubMed 5. 1. Gerlini G., et al. Metastatic melanoma secreted IL-10 down-regulates CD1 molecules on dendritic cells in metastatic tumor lesions. Am. J. Pathol. 2004;165:1853–1863. - PMC - PubMed
## Publication types
## MeSH terms
## Substances
## LinkOut - more resources
* ### Full Text Sources * American Society for Clinical Investigation * Europe PubMed Central * Ovid Technologies, Inc. * PubMed Central * ### Other Literature Sources * The Lens - Patent Citations Database * ### Research Materials * NCI CPTC Antibody Characterization Program


