Proteoglycan desulfation determines the efficiency of chondrocyte autophagy and the extent of FGF signaling during endochondral ossification - PubMed (original) (raw)
Proteoglycan desulfation determines the efficiency of chondrocyte autophagy and the extent of FGF signaling during endochondral ossification
Carmine Settembre et al. Genes Dev. 2008.
Abstract
Cartilage extracellular matrix (ECM) contains large amounts of proteoglycans made of a protein core decorated by highly sulfated sugar chains, the glycosaminoglycans (GAGs). GAGs desulfation, a necessary step for their degradation, is exerted by sulfatases that are activated by another enzyme, Sulfatase-Modifying Factor 1 (SUMF1), whose inactivation in humans leads to severe skeletal abnormalities. We show here that despite being expressed in both osteoblasts and chondrocytes Sumf1 does not affect osteoblast differentiation. Conversely, in chondrocytes it favors ECM production and autophagy and promotes proliferation and differentiation by limiting FGF signaling. Thus, proteoglycan desulfation is a critical regulator of chondrogenesis.
Figures
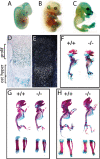
Figure 1.
Skeletal development in Sumf1−/− embryos and mice. (A–C) X-gal-stained Sumf1+/− E12.5, E14.5, and E16.5 embryos. LacZ was expressed in all cartilagineous elements starting at E14.5. (D) Femoral growth plate section showing LacZ staining in proliferating chondrocytes and osteoblasts. (E) In situ hybridization of Sumf1 in E16.5 growth plate. (F_–_H) Alcian blue/alizarin red staining of E16.5 (F), newborn (G), and P4 (H) wild-type and Sumf1−/− embryos and mice. (G,H) Femur and tibia magnification of newborn and P4 _Sumf1_−/− and wild-type mice.
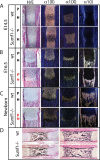
Figure 2.
Sumf1−/− deficiency affects chondrogenesis but not osteogenesis. (A) Hematoxylin/eosin (H/E) staining and in situ hybridization analysis of femoral sections. No differences between Sumf1−/− and wild-type growth plates are observed in E14.5 embryos, while in E16.5 (B) and newborn (C) there is a progressive shortening of both proliferative and hypertrophic area in mutant mice. Expression of α_1(II)_ and α_1(X) Collagen_ was decreased in newborn Sumf1−/− compared with wild-type mice. α_1(I) Collagen_ expression was similar in wild-type and Sumf1−/− samples at all stages analyzed. (D) Von Kossa-Van Gieson staining of femoral sections showed normal mineralization (black staining) in E16.5 and newborn Sumf1−/− mice. Magnification: A–C, 100×, D, 50×.
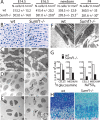
Figure 3.
Defective ECM in _Sumf1_−/− growth plate. (A) Chondrocyte number in the growth plate proliferative zone. Values are the mean ± SD. Student’s test (*) P < 0.05. (B) Toluidin blue staining of chondrocostal cartilage of newborn Sumf1−/− and wild-type littermates. Note the presence of cytoplasmatic vacuolization in Sumf1−/− chondrocytes. (C) EM analysis of E14.5 Sumf1−/− and wild-type chondrocytes showing no evidence of lysosomal vacuolization in Sumf1−/− embryos. (D,E) Cytoplasmatic vacuoles in E16.5 (D) and newborn (E) Sumf1−/− chondrocytes filled with amorphous material (GAGs) and partially degraded collagen fiber (E, inset). (F) Sumf1−/− osteoblasts are less affected than chondrocytes by lysosomal vacuolization. (G) ECM proteoglycan produced by Sumf1−/− and wild-type primary chondrocytes labeled with 3H-glucosamine and Na35SO4. ECM amount was estimated by 3H and 35S incorporation and normalized for cells number. (H) Decreased alcian blue staining in P7 Sumf1−/− compared with wild-type growth plate.
Figure 4.
Abnormal autophagy in Sumf1−/− chondrocytes. (A) Number of BrdU positive cells present in the proliferative zone of the growth plate. Values are the mean ± SD. Student’s test (*) P < 0.05. (B) EM analysis of newborn chondrochostal cartilage revealed the presence of autophagosomes in wild-type chondrocytes. (Boxed inset) Note the double membrane vesicles surrounding a portion of cytoplasm (arrows). (C) Chondrocyte from newborn Sumf1−/− showing more autophagosomes (AV) surrounded by enlarged lysosomes (L). (D) Confocal microscopy analysis of Sumf1−/−;GFP-LC3 and wt;GFP-LC3 growth plate. In GFP-LC3 chondrocytes (left) the GFP fluorescence was more diffused throughout the cytoplasm while in Sumf1−/−;GFP-LC3 it was aggregated in cytoplasmatic dots (right). (E) Western blot analysis showing a 2.5-fold increase in LC3II level in newborn Sumf1−/− chondrocytes. No difference was observed in osteoblasts. Values shown are means of triplicate experiments. (F) Abnormal autophagy in Sumf1−/− chondrocytes during serum and nutrient starvation. Wild-type and Sumf1−/− chondrocytes were starved for the indicated period of time, harvested, and subjected to LC3 immunoblotting. Sumf1−/− chondrocytes and wild type stimulated with Baf presented an increased amount of LC3II compared with wild-type chondrocytes at all time points analyzed. (G) ATP amount is decreased in wild-type chondrocytes when autophagy is inhibited with Baf. Sumf1−/− chondrocytes displayed a lower level of ATP compared with wild-type and Baf treatment did not affected significantly ATP concentration. (H) Wild-type and Sumf1−/− chondrocytes were cultured in serum and glucose-free medium for 2 d. Wild-type chondrocytes were also treated with baf and 3-methyladenine, another inhibitor of autophagy. Cell viability was monitored after 12 h, 24 h, and 48 h. Error bars represent SEM. Student’s test (*) P < 0.05;
(**)P < 0.01.
Figure 5.
Sumf1 regulates FGF18 activity during endochondral ossification. (A) H/E staining of femurs showing shortening of Sumf1−/− bone length (arrowheads) and its rescue in Sumf1−/−;fgf18+/− mice. Brdu staining (B) and in situ expression of α1(II) Collagen (C) and α1(X) Collagen (D) in wild-type (left), Sumf1−/− (middle), and Sumf1−/−;fgf18+/− mice. (E) Quantification of femoral length, BrdU index, and cell number in newborn wild-type, Sumf1−/−, and Sumf1−/−;fgf18+/− mice. At least three mice were analyzed per each genotype. Error bars represent SEM. Student’s test (*) P < 0.05;
(**) P < 0.01. (F) Primary chondrocytes from wild-type and Sumf1−/− mice treated with Fgf18 (20 ng/mL) for the indicated period of time. Note the more sustained phosophorylation of ERK and 70S6k in Sumf1−/− than in wild-type chondrocytes following Fgf18 treatment.
Comment in
- About the importance of being desulfated.
Khatri R, Schipani E. Khatri R, et al. Genes Dev. 2008 Oct 15;22(20):2750-4. doi: 10.1101/gad.1735508. Genes Dev. 2008. PMID: 18923073 Free PMC article.
Similar articles
- Sulfatases are determinants of alveolar formation.
Arteaga-Solis E, Settembre C, Ballabio A, Karsenty G. Arteaga-Solis E, et al. Matrix Biol. 2012 May;31(4):253-60. doi: 10.1016/j.matbio.2012.02.001. Epub 2012 Feb 18. Matrix Biol. 2012. PMID: 22366163 Free PMC article. - Sulfatase modifying factor 1-mediated fibroblast growth factor signaling primes hematopoietic multilineage development.
Buono M, Visigalli I, Bergamasco R, Biffi A, Cosma MP. Buono M, et al. J Exp Med. 2010 Aug 2;207(8):1647-60. doi: 10.1084/jem.20091022. Epub 2010 Jul 19. J Exp Med. 2010. PMID: 20643830 Free PMC article. - Cartilage-Specific Autophagy Deficiency Promotes ER Stress and Impairs Chondrogenesis in PERK-ATF4-CHOP-Dependent Manner.
Kang X, Yang W, Feng D, Jin X, Ma Z, Qian Z, Xie T, Li H, Liu J, Wang R, Li F, Li D, Sun H, Wu S. Kang X, et al. J Bone Miner Res. 2017 Oct;32(10):2128-2141. doi: 10.1002/jbmr.3134. Epub 2017 Apr 14. J Bone Miner Res. 2017. PMID: 28304100 - The skeleton: a multi-functional complex organ: the growth plate chondrocyte and endochondral ossification.
Mackie EJ, Tatarczuch L, Mirams M. Mackie EJ, et al. J Endocrinol. 2011 Nov;211(2):109-21. doi: 10.1530/JOE-11-0048. Epub 2011 Jun 3. J Endocrinol. 2011. PMID: 21642379 Review. - The cartilage extracellular matrix as a transient developmental scaffold for growth plate maturation.
Melrose J, Shu C, Whitelock JM, Lord MS. Melrose J, et al. Matrix Biol. 2016 May-Jul;52-54:363-383. doi: 10.1016/j.matbio.2016.01.008. Epub 2016 Jan 23. Matrix Biol. 2016. PMID: 26807757 Review.
Cited by
- New insight on FGFR3-related chondrodysplasias molecular physiopathology revealed by human chondrocyte gene expression profiling.
Schibler L, Gibbs L, Benoist-Lasselin C, Decraene C, Martinovic J, Loget P, Delezoide AL, Gonzales M, Munnich A, Jais JP, Legeai-Mallet L. Schibler L, et al. PLoS One. 2009 Oct 29;4(10):e7633. doi: 10.1371/journal.pone.0007633. PLoS One. 2009. PMID: 19898608 Free PMC article. - Sulfated hydrogel matrices direct mitogenicity and maintenance of chondrocyte phenotype through activation of FGF signaling.
Öztürk E, Arlov Ø, Aksel S, Li L, Ornitz DM, Skjåk-Bræk G, Zenobi-Wong M. Öztürk E, et al. Adv Funct Mater. 2016 Jun 7;26(21):3649-3662. doi: 10.1002/adfm.201600092. Epub 2016 Mar 23. Adv Funct Mater. 2016. PMID: 28919847 Free PMC article. - Homozygous missense WIPI2 variants cause a congenital disorder of autophagy with neurodevelopmental impairments of variable clinical severity and disease course.
Maroofian R, Gubas A, Kaiyrzhanov R, Scala M, Hundallah K, Severino M, Abdel-Hamid MS, Rosenfeld JA, Ebrahimi-Fakhari D, Ali Z, Rahim F, Houlden H, Tooze SA, Alsaleh NS, Zaki MS. Maroofian R, et al. Brain Commun. 2021 Sep 3;3(3):fcab183. doi: 10.1093/braincomms/fcab183. eCollection 2021. Brain Commun. 2021. PMID: 34557665 Free PMC article. - Regional and disease-specific glycosaminoglycan composition and function in decellularized human lung extracellular matrix.
Hoffman E, Song Y, Zhang F, Asarian L, Downs I, Young B, Han X, Ouyang Y, Xia K, Linhardt RJ, Weiss DJ. Hoffman E, et al. Acta Biomater. 2023 Sep 15;168:388-399. doi: 10.1016/j.actbio.2023.06.043. Epub 2023 Jul 9. Acta Biomater. 2023. PMID: 37433361 Free PMC article. - Molecular landscape of congenital vertebral malformations: recent discoveries and future directions.
Szoszkiewicz A, Bukowska-Olech E, Jamsheer A. Szoszkiewicz A, et al. Orphanet J Rare Dis. 2024 Jan 30;19(1):32. doi: 10.1186/s13023-024-03040-0. Orphanet J Rare Dis. 2024. PMID: 38291488 Free PMC article. Review.
References
- Bame K.J., Esko J.D. Undersulfated heparan sulfate in a Chinese hamster ovary cell mutant defective in heparan sulfate N-sulfotransferase. J. Biol. Chem. 1989;264:8059–8065. - PubMed
- Bishop J.R., Schuksz M., Esko J.D. Heparan sulphate proteoglycans fine-tune mammalian physiology. Nature. 2007;446:1030–1037. - PubMed
- Bulow H.E., Hobert O. The molecular diversity of glycosaminoglycans shapes animal development. Annu. Rev. Cell Dev. Biol. 2006;22:375–407. - PubMed
- Cosma M.P., Pepe S., Annunziata I., Newbold R.F., Grompe M., Parenti G., Ballabio A. The multiple sulfatase deficiency gene encodes an essential and limiting factor for the activity of sulfatases. Cell. 2003;113:445–456. - PubMed
- Diez-Roux G., Ballabio A. Sulfatases and human disease. Annu. Rev. Genomics Hum. Genet. 2005;6:355–379. - PubMed
Publication types
MeSH terms
Substances
LinkOut - more resources
Full Text Sources
Other Literature Sources
Molecular Biology Databases


