A procedure for highly specific, sensitive, and unbiased whole-genome amplification - PubMed (original) (raw)
A procedure for highly specific, sensitive, and unbiased whole-genome amplification
Xinghua Pan et al. Proc Natl Acad Sci U S A. 2008.
Abstract
Highly specific amplification of complex DNA pools without bias or template-independent products (TIPs) remains a challenge. We have developed a method using phi29 DNA polymerase and trehalose and optimized control of amplification to create micrograms of specific amplicons without TIPs from down to subfemtograms of DNA. With an input of as little as 0.5-2.5 ng of human gDNA or a few cells, the product could be close to native DNA in locus representation. The amplicons from 5 and 0.5 ng of DNA faithfully demonstrated all previously known heterozygous segmental duplications and deletions (3 Mb to 18 kb) located on chromosome 22 and even a homozygous deletion smaller than 1 kb with high-resolution chromosome-wide comparative genomic hybridization. With 550k Infinium BeadChip SNP typing, the >99.7% accuracy was compared favorably with results on unamplified DNA. Importantly, underrepresentation of chromosome termini that occurred with GenomiPhi v2 was greatly rescued with the present procedure, and the call rate and accuracy of SNP typing were also improved for the amplicons with a 0.5-ng, partially degraded DNA input. In addition, the amplification proceeded logarithmically in terms of total yield before saturation; the intact cells was amplified >50 times more efficiently than an equivalent amount of extracted DNA; and the locus imbalance for amplicons with 0.1 ng or lower input of DNA was variable, whereas for higher input it was largely reproducible. This procedure facilitates genomic analysis with single cells or other traces of DNA, and generates products suitable for analysis by massively parallel sequencing as well as microarray hybridization.
Conflict of interest statement
The authors declare no conflict of interest.
Figures
Fig. 1.
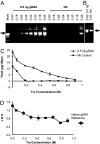
At appropriate Tre concentrations, TIPs were eliminated, and the locus representation of the amplicon was improved. Extracted gDNA (0.5 ng) vs. Ntr control was tested. Tre preparation lot T808 was used. The numbers above refer the final concentration of Tre. Arrow: 12 kb. (A) Tre concentration was varied from 0.06 to 0.9 M in a 100-μl reaction. Mark: 1-kb DNA ladder (Invitrogen). (B) Without Tre. (C) Product yields at different Tre concentrations, duplicate measurements by PicoGreen assay (two times). (D) LBS (
SI Text
) of products at different Tre concentrations, and LBS of reference gDNA. The measurement was repeated (two times) for each amplicon, and multiply repeated (nine times) for the reference in different independent tests.
Fig. 2.
SYBR Green real-time monitoring of the amplification reaction (80 μl) with trace gDNA inputs. The reaction was ended at 26 h. RFU, relative fluorescence unit; Ct, cycle threshold. (A) Time course of amplification. Input was ranged from 100 pg to 0.01 fg of extracted gDNA, intact cells, and Ntr control. The variation among cells a, b, and c may reflect the variation in their actual cell numbers or in preparing the amplification reaction. (B) The log2 input in femtograms showed a linear relationship with the Ct from 0.1 ng to 0.01 fg (eight orders of magnitude). Signal was collected every cycle (15 min).
Fig. 3.
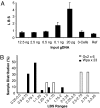
LBS of amplicons with different initial DNA inputs. (A) Different amounts of purified gDNA amplified with the general amplification procedure of Wpa (see
Table S2
for detailed data). Each sample was repeated twice for qPCR LBS assessment (
SI Text
), and the mean was taken. (B) Direct amplification from a single to a few cells (2.8 ± 1.9 cells) with Wpa vs. Gv2. In total, 23 and 6 samples were amplified with Wpa and Gv2, respectively.
Fig. 4.
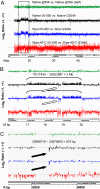
Amplicon hybridization on a chromosome 22 tiling array reproduced the known chromosomal segment aberrations seen with a native DNA (sample 05-050). The NimbleGen data from arrays were analyzed with NimbleScan 2.3 at CGH DNACopy function option, in which the two channels of signals (Cy3, test sample; Cy5, control) were normalized with Qspline-fit normalization (a minimized nonlinear normalization) and sliding with specified windows. The output gff files [log2 ratio of signals of Cy3 vs. Cy5 (
Table S4
)] were displayed in Integrated Genome Browser (IGB) (Affymetrix). The “Native gDNA vs. Native gDNA self” (green) is an unamplified 04-018 gDNA against itself. The native DNA set (black) is native 05-050 vs. native G304A. All other Cy3/Cy5 sets are the amplicon of test sample (05-050) vs. amplicon of normal DNA control (G304A). Blue and red refer to the amplification procedure described in this article, Wpa and Wpa-40°C. The labels at the bottom are the chromosome 22 bands and coordinates. (A) The whole chromosome 22 long arm at 2-kb sliding window. The dotted rectangle is the segment zoomed in B. (B) Zoom-in view of the region labeled in A covering a segment with a known heterozygous duplication (3.0 Mb) and analyzed with a 2-kb sliding window. Open arrows indicate reversed signals due to cross-hybridization of the repeat sequence LCR, as analyzed earlier (37). (C) Expansion of a confirmed 975-bp homologous deletion (filled arrows) with a 400-bp sliding window.
Fig. 5.
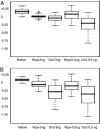
The mean LRR of 5-Mb termini for all chromosomes applicable, shown in boxplot: minimum, first quartile, median, third quartile and maximum. Outliers are shown as open circles. The log R ratio (LRR) utilizes a collection of multiple native gDNAs as a reference, and it reflects a ratio of amplicon test vs. native reference. This calculation is based on the LRR of all SNPs within 5 Mb of 39 chromosome termini that are represented on the array (
Tables S6 and S7
). (A) For sample 05-050. (B) For sample 04-018, which was slightly degraded.
Similar articles
- Evaluation of Phi29-based whole-genome amplification for microarray-based comparative genomic hybridisation.
Arriola E, Lambros MB, Jones C, Dexter T, Mackay A, Tan DS, Tamber N, Fenwick K, Ashworth A, Dowsett M, Reis-Filho JS. Arriola E, et al. Lab Invest. 2007 Jan;87(1):75-83. doi: 10.1038/labinvest.3700495. Lab Invest. 2007. PMID: 17170740 - Balanced-PCR amplification allows unbiased identification of genomic copy changes in minute cell and tissue samples.
Wang G, Brennan C, Rook M, Wolfe JL, Leo C, Chin L, Pan H, Liu WH, Price B, Makrigiorgos GM. Wang G, et al. Nucleic Acids Res. 2004 May 21;32(9):e76. doi: 10.1093/nar/gnh070. Nucleic Acids Res. 2004. PMID: 15155823 Free PMC article. - Effects of DNA mass on multiple displacement whole genome amplification and genotyping performance.
Bergen AW, Qi Y, Haque KA, Welch RA, Chanock SJ. Bergen AW, et al. BMC Biotechnol. 2005 Sep 16;5:24. doi: 10.1186/1472-6750-5-24. BMC Biotechnol. 2005. PMID: 16168060 Free PMC article. - Multiple displacement amplification to create a long-lasting source of DNA for genetic studies.
Lovmar L, Syvänen AC. Lovmar L, et al. Hum Mutat. 2006 Jul;27(7):603-14. doi: 10.1002/humu.20341. Hum Mutat. 2006. PMID: 16786504 Review.
Cited by
- Beyond bacteria: a study of the enteric microbial consortium in extremely low birth weight infants.
LaTuga MS, Ellis JC, Cotton CM, Goldberg RN, Wynn JL, Jackson RB, Seed PC. LaTuga MS, et al. PLoS One. 2011;6(12):e27858. doi: 10.1371/journal.pone.0027858. Epub 2011 Dec 8. PLoS One. 2011. PMID: 22174751 Free PMC article. - Two methods for full-length RNA sequencing for low quantities of cells and single cells.
Pan X, Durrett RE, Zhu H, Tanaka Y, Li Y, Zi X, Marjani SL, Euskirchen G, Ma C, Lamotte RH, Park IH, Snyder MP, Mason CE, Weissman SM. Pan X, et al. Proc Natl Acad Sci U S A. 2013 Jan 8;110(2):594-9. doi: 10.1073/pnas.1217322109. Epub 2012 Dec 24. Proc Natl Acad Sci U S A. 2013. PMID: 23267071 Free PMC article. - Reconstructing each cell's genome within complex microbial communities-dream or reality?
Clingenpeel S, Clum A, Schwientek P, Rinke C, Woyke T. Clingenpeel S, et al. Front Microbiol. 2015 Jan 8;5:771. doi: 10.3389/fmicb.2014.00771. eCollection 2014. Front Microbiol. 2015. PMID: 25620966 Free PMC article. - Direct squencing from the minimal number of DNA molecules needed to fill a 454 picotiterplate.
Džunková M, Garcia-Garcerà M, Martínez-Priego L, D'Auria G, Calafell F, Moya A. Džunková M, et al. PLoS One. 2014 Jun 2;9(6):e97379. doi: 10.1371/journal.pone.0097379. eCollection 2014. PLoS One. 2014. PMID: 24887077 Free PMC article. - Improved multiple displacement amplification (iMDA) and ultraclean reagents.
Motley ST, Picuri JM, Crowder CD, Minich JJ, Hofstadler SA, Eshoo MW. Motley ST, et al. BMC Genomics. 2014 Jun 6;15(1):443. doi: 10.1186/1471-2164-15-443. BMC Genomics. 2014. PMID: 24906487 Free PMC article.
References
- Hutchison CA, III, Venter JC. Single-cell genomics. Nat Biotechnol. 2006;24:657–658. - PubMed
- Lasken RS. Single-cell genomic sequencing using multiple displacement amplification. Curr Opin Microbiol. 2007;10:510–516. - PubMed
- Hughes S, Arneson N, Done S, Squire J. The use of whole genome amplification in the study of human disease. Prog Biophys Mol Biol. 2005;88:173–189. - PubMed
Publication types
MeSH terms
Substances
Grants and funding
- P30 DK072442/DK/NIDDK NIH HHS/United States
- R01 AG023111/AG/NIA NIH HHS/United States
- R01 AG23111/AG/NIA NIH HHS/United States
- P30 DK072442-03/DK/NIDDK NIH HHS/United States
- P30 AR041942/AR/NIAMS NIH HHS/United States
- P50 CA121974/CA/NCI NIH HHS/United States
- 5 P30 AR41942-14/AR/NIAMS NIH HHS/United States
- HG02357-01/HG/NHGRI NIH HHS/United States
- 1 P50 CA121974/CA/NCI NIH HHS/United States
- P50 HG002357/HG/NHGRI NIH HHS/United States
LinkOut - more resources
Full Text Sources
Other Literature Sources
Molecular Biology Databases
Miscellaneous


