A minimalist network model for coarse-grained normal mode analysis and its application to biomolecular x-ray crystallography - PubMed (original) (raw)
A minimalist network model for coarse-grained normal mode analysis and its application to biomolecular x-ray crystallography
Mingyang Lu et al. Proc Natl Acad Sci U S A. 2008.
Abstract
In this article, we report a method for coarse-grained normal mode analysis called the minimalist network model. The main features of the method are that it can deliver accurate low-frequency modes on structures without undergoing initial energy minimization and that it also retains the details of molecular interactions. The method does not require any additional adjustable parameters after coarse graining and is computationally very fast. Tests on modeling the experimentally measured anisotropic displacement parameters in biomolecular x-ray crystallography demonstrate that the method can consistently perform better than other commonly used methods including our own one. We expect this method to be effective for applications such as structural refinement and conformational sampling.
Conflict of interest statement
The authors declare no conflict of interest.
Figures
Fig. 1.
The distribution of heavy-atom RMSD between protein structures before and after initial energy minimization. The histogram was generated from 83 ultra-high-resolution protein crystal structures, which have at least 50 residues, are at least 1 Å in resolution, and share <50% sequence identity. For more details on the protein test set and minimization protocol, see Methods.
Fig. 2.
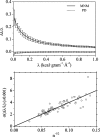
Relative differences of eigenvalues. (Upper) Average relative difference of eigenvalues as a function of RTB eigenvalues for PD (dashed line) and the MNM (solid line). The statistics were derived from the first 1,000 modes with eigenvalues of <1.0 kcal·g−1·Å−2 on all 83 ultra-high-resolution protein structures. The SDs are shown as vertical lines. (Lower) SDs for relative differences of eigenvalues (circles) as a function of inverse square root of the number of residues (n). For each of the 83 test proteins, the SD was calculated for the first 1,000 normal modes with eigenvalues ranging from 0.2 to 0.8 kcal·g−1·Å−2 (as a representative range). The linear correlation coefficient is 0.97, and the slope is ≈0.04.
Fig. 3.
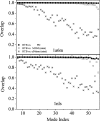
Overlap of the lowest-frequency mode subspaces between various normal mode analyses. Tests were performed on two proteins: PDB ID codes 1a6m (Upper) and 1nls (Lower). The methods RTB, PD, MNM, and elNémo were applied to the structures after energy minimization, and overlap was calculated by projecting the modes of each method onto the 50-lowest-frequency-normal-mode subspace of RTB.
Fig. 4.
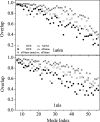
Overlap of the lowest-frequency mode subspaces between various normal mode analyses. Tests were performed on two proteins: PDB ID codes 1a6m (Upper) and 1nls (Lower). The MNM was applied to relaxed structures, RTB to native structure, and elNémo to both native and minimized structures. For all comparisons, overlap was calculated by projecting the modes of each method onto the 50-lowest-frequency-normal-mode subspace of RTB, with the exception of the overlap between the two elNémo methods (stars), for which the modes were projected onto the 50-lowest-frequency-normal-mode subspace of elNémo on minimized structures.
Fig. 5.
Average KL distance improvement from RTB (on minimized structures) to the MNM (on unminimized structures) as a function of atomic positional deviation after energy minimization. The changes in KL distance from RTB to the MNM (Δ_D_KL = DKLRTB − DKLMNM) were calculated and averaged over atoms with similar positional deviations. This figure presents both the histogram of deviations (y axis to the left) and the average improvements in KL distance (y axis to the right). The average KL distance from RTB to the MNM improves for all deviation ranges (i.e., Δ_D_KL > 0), and the improvements tend to be larger for larger structure deviations.
Similar articles
- Coarse-graining of protein structures for the normal mode studies.
Eom K, Baek SC, Ahn JH, Na S. Eom K, et al. J Comput Chem. 2007 Jun;28(8):1400-10. doi: 10.1002/jcc.20672. J Comput Chem. 2007. PMID: 17330878 - Domain decomposition-based structural condensation of large protein structures for understanding their conformational dynamics.
Kim JI, Na S, Eom K. Kim JI, et al. J Comput Chem. 2011 Jan 15;32(1):161-9. doi: 10.1002/jcc.21613. J Comput Chem. 2011. PMID: 20645300 - High-resolution modeling of protein structures based on flexible fitting of low-resolution structural data.
Zheng W, Tekpinar M. Zheng W, et al. Adv Protein Chem Struct Biol. 2014;96:267-84. doi: 10.1016/bs.apcsb.2014.06.004. Epub 2014 Aug 24. Adv Protein Chem Struct Biol. 2014. PMID: 25443961 Review. - Multiscale Coarse-Graining via Normal Mode Analysis.
Xia F, Lu L. Xia F, et al. J Chem Theory Comput. 2012 Nov 13;8(11):4797-806. doi: 10.1021/ct3006387. Epub 2012 Sep 26. J Chem Theory Comput. 2012. PMID: 26605632 - Coarse-grained normal mode analysis in structural biology.
Bahar I, Rader AJ. Bahar I, et al. Curr Opin Struct Biol. 2005 Oct;15(5):586-92. doi: 10.1016/j.sbi.2005.08.007. Curr Opin Struct Biol. 2005. PMID: 16143512 Free PMC article. Review.
Cited by
- PIM: phase integrated method for normal mode analysis of biomolecules in a crystalline environment.
Lu M, Ma J. Lu M, et al. J Mol Biol. 2013 Mar 25;425(6):1082-98. doi: 10.1016/j.jmb.2012.12.026. Epub 2013 Jan 16. J Mol Biol. 2013. PMID: 23333742 Free PMC article. - fSUB: normal mode analysis with flexible substructures.
Lu M, Ming D, Ma J. Lu M, et al. J Phys Chem B. 2012 Jul 26;116(29):8636-45. doi: 10.1021/jp300312u. Epub 2012 Apr 5. J Phys Chem B. 2012. PMID: 22448847 Free PMC article. - Focused functional dynamics of supramolecules by use of a mixed-resolution elastic network model.
Kurkcuoglu O, Turgut OT, Cansu S, Jernigan RL, Doruker P. Kurkcuoglu O, et al. Biophys J. 2009 Aug 19;97(4):1178-87. doi: 10.1016/j.bpj.2009.06.009. Biophys J. 2009. PMID: 19686666 Free PMC article. - Temperature dependence of fluctuations in HIV1-protease.
Hamacher K. Hamacher K. Eur Biophys J. 2010 Jun;39(7):1051-6. doi: 10.1007/s00249-009-0443-z. Epub 2009 Mar 27. Eur Biophys J. 2010. PMID: 19326111 - Anharmonic normal mode analysis of elastic network model improves the modeling of atomic fluctuations in protein crystal structures.
Zheng W. Zheng W. Biophys J. 2010 Jun 16;98(12):3025-34. doi: 10.1016/j.bpj.2010.03.027. Biophys J. 2010. PMID: 20550915 Free PMC article.
References
- Levitt M, Sander C, Stern PS. Protein normal-mode dynamics: Trypsin inhibitor, crambin, ribonuclease and lysozyme. J Mol Biol. 1985;181:423–447. - PubMed
- Brooks BR, Janezic D, Karplus M. Harmonic analysis of large systems. I. Methodology. J Comput Chem. 1995;16:1522–1542.
- Ma J. Usefulness and limitations of normal mode analysis in modeling dynamics of biomolecular complexes. Structure (London) 2005;13:373–380. - PubMed
Publication types
MeSH terms
Substances
LinkOut - more resources
Full Text Sources


