High accuracy 3D quantum dot tracking with multifocal plane microscopy for the study of fast intracellular dynamics in live cells - PubMed (original) (raw)
High accuracy 3D quantum dot tracking with multifocal plane microscopy for the study of fast intracellular dynamics in live cells
Sripad Ram et al. Biophys J. 2008.
Abstract
Single particle tracking in three dimensions in a live cell environment holds the promise of revealing important new biological insights. However, conventional microscopy-based imaging techniques are not well suited for fast three-dimensional (3D) tracking of single particles in cells. Previously we developed an imaging modality multifocal plane microscopy (MUM) to image fast intracellular dynamics in three dimensions in live cells. Here, we introduce an algorithm, the MUM localization algorithm (MUMLA), to determine the 3D position of a point source that is imaged using MUM. We validate MUMLA through simulated and experimental data and show that the 3D position of quantum dots can be determined over a wide spatial range. We demonstrate that MUMLA indeed provides the best possible accuracy with which the 3D position can be determined. Our analysis shows that MUM overcomes the poor depth discrimination of the conventional microscope, and thereby paves the way for high accuracy tracking of nanoparticles in a live cell environment. Here, using MUM and MUMLA we report for the first time the full 3D trajectories of QD-labeled antibody molecules undergoing endocytosis in live cells from the plasma membrane to the sorting endosome deep inside the cell.
Figures
FIGURE 1
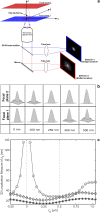
Multifocal plane microscopy. (a) The schematic of a multifocal plane microscope that can simultaneously image two distinct planes within the sample. The figure illustrates the effect of changing the position of the detector relative to the tube lens, which results in imaging a plane that is distinct from the plane that is imaged by the detector positioned at the design location. (b) Simulated images of a point source at different z positions when imaged through a two-plane MUM setup. Here the z locations are specified with respect to focal plane 1. When the point source is close to the plane of focus (|_z_0| ≤ 250 nm) and is imaged in only one focal plane (i.e., a conventional microscope), the resulting image profiles show negligible change in their shape thereby providing very little information about the z location (see bottom row, focal plane 1). On the other hand, if, in addition, the point source is simultaneously imaged at a second focal plane that is distinct from the first one (i.e., two-plane MUM setup), then, for the same range of z values, the image profiles of the point source acquired in this second plane show significant change in their shape (top row, focal plane 2). (c) Accuracy with which the z position of a point source can be determined for a conventional microscope (°) and for a two-plane MUM setup (⋄, *). The vertical dotted lines indicate the position of the two focal planes in the MUM setup. In a conventional microscope, when the point source is close to the plane of focus (|_z_0| ≤ 250 nm), there is very high uncertainty in determining its z position (number of detected photons = 2000). In contrast, in a MUM setup, the z location can be determined with relatively high accuracy when the point source is close to the plane of focus. In particular, the accuracy of the _z_-position determination remains relatively constant for a range of _z_0 values (⋄, number of detected photons/plane = 1000). Note that by collecting more photons from the point source per plane, the accuracy of the _z_-position determination can be consistently improved for a range of _z_0 values (*, number of detected photons/plane = 2000). In all the plots, the numerical aperture of the objective lens is set to 1.45; the wavelength is set to 655 nm, the pixel array size is set to 11 × 11; the pixel size is set to 16 _μ_m × 16 _μ_m; the _X_-Y location coordinates of the point source are assumed to coincide with the center of the pixel array; the exposure time is set to 0.2 s or 0.4 s; and the standard deviation of the readout noise is set to 6 _e_−/pixel. For the conventional microscope (MUM setup), the photon detection rate, background and magnification are set to 10,000 photon/s (5000 photons/s per plane), 800 photons/pixel/s (400 photons/pixel/s per plane), and M = 100 (_M_1 = 100, _M_2 = 97.9), respectively.
FIGURE 2
Verification of MUMLA. (a) Results of _z_-position estimates from simulated data for a QD label. Two-plane MUM images were simulated for different _z_-position values, where the plane spacing between the two focal planes in the object space was assumed to be 500 nm. The z position from the simulated data was obtained using MUMLA. The plot shows the estimates of z position (°) at each value of _z_0 along with the true value of _z_0 (—). (b and c) Results of _z_-position estimates of two QD labels from experimental data. For panel b, a cell sample (stationary QD sample 1) that was pulsed with QD labeled IgG molecules and fixed was imaged in a two-plane MUM setup (focal plane spacing in object space = 300 nm). The objective was moved in 50-nm steps with a piezo-nanopositioner and at each piezo position several images of the specimen was acquired. The z position of an arbitrarily chosen QD was determined using MUMLA. The plot shows the estimates of z position (°) for one of the QDs at various piezo positions along with the mean value of the _z_-position estimates for each piezo position (—). For panel c, sparsely dispersed QDs on a cover glass (stationary QD sample 2) were imaged in a two-plane MUM setup (focal plane spacing in object space = 1.2 _μ_m). The objective was moved in 200-nm steps with a piezo-nanopositioner and at each piezo position several images of the specimen were acquired. The z position of an arbitrarily chosen QD was determined using MUMLA in combination with the calibration plot (see Results for details). The plot shows the estimates of z position (°) for one of the QDs at various piezo positions along with the mean value of the _z_-position estimates for each piezo position (—).
FIGURE 3
Effect of signal and noise statistics on the 3D localization measure. The figure shows the variation of the 3D localization measure of _z_0 for a two-plane MUM setup as a function of the expected number of detected photons per plane for readout noise levels of 6 _e_−/pixel (°) and 15 _e_−/pixel (⋄). In all the plots, the photon detection rate is set to 5000 photons/s per plane, the background rate is set to 200 photons/pixel/s per plane, and the _x_-axis range corresponds to an exposure time range of t = 0.1–2 s. All other numerical values are identical to those used in Fig. 1 c.
FIGURE 4
Effect of detector pixel size on the 3D localization measure. The figure shows the variation of the 3D localization measure of _z_0 as a function of the detector pixel size for a two-plane MUM setup for _z_-position values of 250 nm (⋄) and 150 nm (*). We assume the pixel size and the readout noise statistics to be the same for both focal plane images. In all the plots, the background component is set to zero; the standard deviation of the readout noise is set to 6 _e_−/pixel; the exposure time is set to 0.2 s; the photon detection rate is set to 5000 photons/s per plane; and the pixel array is set to 500 × 500 _μ_m. The pixel sizes were chosen such that the pixel array consists of an odd number of rows and columns. All other numerical values are identical to those used in Fig. 1 c.
FIGURE 5
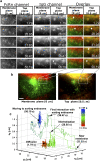
Complex 3D trafficking itinerary of a QD-IgG molecule undergoing endocytosis. (a) Montages for FcRn and IgG channels along with the overlay displaying areas of interest of a transfected HMEC-1 cell with the time (in seconds) at which each image was acquired. Each row in the montage corresponds to a pair of images that was simultaneously acquired at the plasma membrane plane and at a plane that is 500 nm above the plasma membrane plane. In the overlay montage, FcRn is shown in green and IgG is shown in red. The QD-IgG molecule that is tracked is indicated by a white arrow. In some of the frames (e.g., see t = 28.05 s in the IgG channel), the image of the QD label visually appears as a very dim spot, but is detectable by MUMLA. The images in the IgG channels were acquired at a frame rate of 12 frames/s. The images shown are individual frames taken from
Movie S1
. Bar = 1 _μ_m. (b) Snapshot of the raw MUM data with the FcRn and IgG channels overlaid. The white box indicates the region in the cell that is shown in the montages. The red haze seen in the membrane and top planes is due to the presence of QD-IgG molecules in the imaging medium. Bar = 5 _μ_m. (c) 3D trajectory of the QD-IgG molecule. The trajectory is color-coded to indicate time. The color change from red to green to blue indicates increasing time. The QD-IgG positions indicated by arrows correspond to the images shown in panel a. The molecule is initially seen to be randomly diffusing on the plasma membrane. The endocytosis of the molecule is characterized by an abrupt change in its z location where the molecule moves inside the cell to a depth of 300 nm from the plasma membrane. After internalization, the molecule moves in a highly directed manner and takes an elaborate route to traffic deep inside the cell (800 nm from the plasma membrane) until it reaches a sorting endosome. The molecule briefly interacts with the sorting endosome, loops around it and then, after several repeated contacts, merges with the sorting endosome. See also Fig. S3 in
Data S1
for a plot of the _z_0 coordinate as a function of time.
FIGURE 6
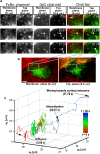
Endocytosed QD-IgG molecule moves directly to the sorting endosome. (a) Montages for FcRn and IgG channels along with the overlay displaying areas of interest of a transfected HMEC-1 cell with the time (in seconds) at which each image was acquired. Each row in the montage corresponds to a pair of images that was simultaneously acquired at the plasma membrane plane and at a plane that is 500 nm above the plasma membrane plane. In the overlay montage, FcRn is shown in green and IgG is shown in red. The QD-IgG molecule that is tracked is indicated by a white arrow. The images in the QD channels were acquired at a frame rate of 12 frames/s. The images shown are individual frames taken from
Movie S2
. Bar = 1 _μ_m. (b) Snapshot of the raw MUM data with the FcRn and IgG channels overlaid. The white box indicates the region in the cell that is shown in the montages. The red haze seen in the membrane and top planes is due to the presence of QD-IgG molecules in the imaging medium. Bar = 5 _μ_m. (c) 3D trajectory of the QD-IgG molecule. The trajectory is color-coded to indicate time. The color change from red to green to blue indicates increasing time. The QD-IgG positions indicated by arrows correspond to the images shown in panel a. The QD-IgG molecule is initially observed to be diffusing on the plasma membrane for a significant period of time (t = 0–29.67 s). Before internalization, the molecule becomes stationary and then moves inside the cell in a highly directed manner toward a sorting endosome. See also Fig. S4 in
Data S1
for a plot of the _z_0 coordinate as a function of time.
Similar articles
- 3D single molecule tracking with multifocal plane microscopy reveals rapid intercellular transferrin transport at epithelial cell barriers.
Ram S, Kim D, Ober RJ, Ward ES. Ram S, et al. Biophys J. 2012 Oct 3;103(7):1594-603. doi: 10.1016/j.bpj.2012.08.054. Epub 2012 Oct 2. Biophys J. 2012. PMID: 23062352 Free PMC article. - Localizing single molecules in three dimensions - a brief review.
Ram S, Prabhat P, Chao J, Abraham AV, Ward ES, Ober RJ. Ram S, et al. Conf Rec Asilomar Conf Signals Syst Comput. 2008 Oct 26:64-66. doi: 10.1109/ACSSC.2008.5074362. Conf Rec Asilomar Conf Signals Syst Comput. 2008. PMID: 21887405 Free PMC article. - 3D single molecule tracking of quantum-dot labeled antibody molecules using multifocal plane microscopy.
Ram S, Prabhat P, Chao J, Ward ES, Ober RJ. Ram S, et al. Proc SPIE Int Soc Opt Eng. 2010 Feb 1;7575:75750J. doi: 10.1117/12.848940. Epub 2010 Feb 17. Proc SPIE Int Soc Opt Eng. 2010. PMID: 22916318 Free PMC article. - Potential and limitations of microscopy and Raman spectroscopy for live-cell analysis of 3D cell cultures.
Charwat V, Schütze K, Holnthoner W, Lavrentieva A, Gangnus R, Hofbauer P, Hoffmann C, Angres B, Kasper C. Charwat V, et al. J Biotechnol. 2015 Jul 10;205:70-81. doi: 10.1016/j.jbiotec.2015.02.007. Epub 2015 Feb 14. J Biotechnol. 2015. PMID: 25687101 Review. - Tracking single viruses infecting their host cells using quantum dots.
Liu SL, Wang ZG, Zhang ZL, Pang DW. Liu SL, et al. Chem Soc Rev. 2016 Mar 7;45(5):1211-24. doi: 10.1039/c5cs00657k. Chem Soc Rev. 2016. PMID: 26695711 Review.
Cited by
- 3D single molecule tracking with multifocal plane microscopy reveals rapid intercellular transferrin transport at epithelial cell barriers.
Ram S, Kim D, Ober RJ, Ward ES. Ram S, et al. Biophys J. 2012 Oct 3;103(7):1594-603. doi: 10.1016/j.bpj.2012.08.054. Epub 2012 Oct 2. Biophys J. 2012. PMID: 23062352 Free PMC article. - Approach to map nanotopography of cell surface receptors.
Franke C, Chum T, Kvíčalová Z, Glatzová D, Gentsch GJ, Rodriguez A, Helmerich DA, Herdly L, Mavila H, Frank O, Brdička T, van de Linde S, Cebecauer M. Franke C, et al. Commun Biol. 2022 Mar 9;5(1):218. doi: 10.1038/s42003-022-03152-y. Commun Biol. 2022. PMID: 35264712 Free PMC article. - Remote focusing multifocal plane microscopy for the imaging of 3D single molecule dynamics with cellular context.
Chao J, Velmurugan R, You S, Kim D, Ward ES, Ober RJ. Chao J, et al. Proc SPIE Int Soc Opt Eng. 2017 Jan 28;10070:100700L. doi: 10.1117/12.2251218. Epub 2017 Feb 17. Proc SPIE Int Soc Opt Eng. 2017. PMID: 28603332 Free PMC article. - Long axial-range double-helix point spread functions for 3D volumetric super-resolution imaging.
Nakatani Y, Gaumer S, Shechtman Y, Gustavsson AK. Nakatani Y, et al. bioRxiv [Preprint]. 2024 Aug 1:2024.07.31.605907. doi: 10.1101/2024.07.31.605907. bioRxiv. 2024. PMID: 39131321 Free PMC article. Updated. Preprint. - An information-theoretic approach to designing the plane spacing for multifocal plane microscopy.
Tahmasbi A, Ram S, Chao J, Abraham AV, Ward ES, Ober RJ. Tahmasbi A, et al. Proc SPIE Int Soc Opt Eng. 2015 Feb 7;9330:933011. doi: 10.1117/12.2076769. Proc SPIE Int Soc Opt Eng. 2015. PMID: 26113764 Free PMC article.
References
- Zenisek, D., J. A. Steyer, and W. Almers. 2000. Transport, capture and exocytosis of single synaptic vesicles at active zones. Nature. 406:849–854. - PubMed
- Ehrlich, M., W. Boll, A.Van Oijen, R. Haniharan, K. Chandran, M. L. Nibert, and T. Kirchhausen. 2004. Endocytosis by random initiation and stabilization of clathrin-coated pits. Cell. 118:591–605. - PubMed
Publication types
MeSH terms
Substances
LinkOut - more resources
Full Text Sources
Other Literature Sources


