Variations in the transcriptome of Alzheimer's disease reveal molecular networks involved in cardiovascular diseases - PubMed (original) (raw)
Variations in the transcriptome of Alzheimer's disease reveal molecular networks involved in cardiovascular diseases
Monika Ray et al. Genome Biol. 2008.
Abstract
Background: Because of its polygenic nature, Alzheimer's disease is believed to be caused not by defects in single genes, but rather by variations in a large number of genes and their complex interactions. A systems biology approach, such as the generation of a network of co-expressed genes and the identification of functional modules and cis-regulatory elements, to extract insights and knowledge from microarray data will lead to a better understanding of complex diseases such as Alzheimer's disease. In this study, we perform a series of analyses using co-expression networks, cis-regulatory elements, and functions of co-expressed gene modules to analyze single-cell gene expression data from normal and Alzheimer's disease-affected subjects.
Results: We identified six co-expressed gene modules, each of which represented a biological process perturbed in Alzheimer's disease. Alzheimer's disease-related genes, such as APOE, A2M, PON2 and MAP4, and cardiovascular disease-associated genes, including COMT, CBS and WNK1, all congregated in a single module. Some of the disease-related genes were hub genes while many of them were directly connected to one or more hub genes. Further investigation of this disease-associated module revealed cis-regulatory elements that match to the binding sites of transcription factors involved in Alzheimer's disease and cardiovascular disease.
Conclusion: Our results show the extensive links between Alzheimer's disease and cardiovascular disease at the co-expression and co-regulation levels, providing further evidence for the hypothesis that cardiovascular disease and Alzheimer's disease are linked. Our results support the notion that diseases in which the same set of biochemical pathways are affected may tend to co-occur with each other.
Figures
Figure 1
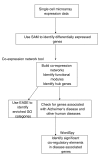
Steps taken to analyze Alzheimer's disease using laser capture microdissected microarray data. Sequence of steps taken to analyze incipient Alzheimer's disease from single cell expression data. We apply co-expression network analysis, EASE and WordSpy (motif finding method) in an integrated manner to study Alzheimer's disease and reveal connections to other conditions such as cardiovascular diseases and diabetes.
Figure 2
Unsupervised classification by principal component analysis. Principal component analysis was used to classify the 33 samples. The blue spheres refer to controls and the red correspond to affected subjects. This demonstrated that the samples were distinguishable based on the expression profiles of 1,663 differentially expressed genes.
Figure 3
Adjacency matrix of co-expression network. The adjacency matrix representation of the co-expression network. Modules are labeled c1, c2, c3, c4, c5 and c6. The dots refer to the intra- and inter-module edges between the genes. The graphical representation of this matrix is in Additional data file 4.
Figure 4
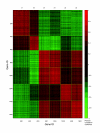
Pearson correlation coefficient between 1,663 genes. This figure shows the strength of correlation between pairs of genes. The genes are organized by modules - c1, c2, c3, c4, c5 and c6. The top leftmost red block on the diagonal corresponds to module c1 and the bottom rightmost red block on the same diagonal refers to module c6. Modules c1 and c2 contain upregulated genes and modules c3 through c6 comprise downregulated genes.
Figure 5
Sub-network in module 1 illustrating the 18 disease associated genes and their connections. This sub-network shows the 18 disease associated genes (colored yellow) and the genes that they are connected to within module 1. The hub genes are represented as triangle nodes. Disease genes MAP4, PON2 and ATP1A2 were also hub genes. Only the hub genes that connect to disease genes are shown here. Module 1 consists of 22 hub genes in total.
Similar articles
- Intrinsic-overlapping co-expression module detection with application to Alzheimer's Disease.
Manners HN, Roy S, Kalita JK. Manners HN, et al. Comput Biol Chem. 2018 Dec;77:373-389. doi: 10.1016/j.compbiolchem.2018.10.014. Epub 2018 Nov 9. Comput Biol Chem. 2018. PMID: 30466046 - Identification of therapeutic targets for Alzheimer's disease via differentially expressed gene and weighted gene co-expression network analyses.
Jia Y, Nie K, Li J, Liang X, Zhang X. Jia Y, et al. Mol Med Rep. 2016 Nov;14(5):4844-4848. doi: 10.3892/mmr.2016.5828. Epub 2016 Oct 12. Mol Med Rep. 2016. PMID: 27748870 - [Identification of potential hub genes of Alzheimer's disease by weighted gene co-expression network analysis].
Xue J, Liu J, Geng M, Yue J, He H, Fan J. Xue J, et al. Nan Fang Yi Ke Da Xue Xue Bao. 2021 Dec 20;41(12):1752-1762. doi: 10.12122/j.issn.1673-4254.2021.12.01. Nan Fang Yi Ke Da Xue Xue Bao. 2021. PMID: 35012905 Free PMC article. Chinese. - Comparison of Methods for Differential Co-expression Analysis for Disease Biomarker Prediction.
Kakati T, Bhattacharyya DK, Barah P, Kalita JK. Kakati T, et al. Comput Biol Med. 2019 Oct;113:103380. doi: 10.1016/j.compbiomed.2019.103380. Epub 2019 Aug 10. Comput Biol Med. 2019. PMID: 31415946 Review. - Systems biology and gene networks in Alzheimer's disease.
Wang ZT, Tan CC, Tan L, Yu JT. Wang ZT, et al. Neurosci Biobehav Rev. 2019 Jan;96:31-44. doi: 10.1016/j.neubiorev.2018.11.007. Epub 2018 Nov 20. Neurosci Biobehav Rev. 2019. PMID: 30465785 Review.
Cited by
- Complex disease interventions from a network model for type 2 diabetes.
Rende D, Baysal N, Kirdar B. Rende D, et al. PLoS One. 2013 Jun 11;8(6):e65854. doi: 10.1371/journal.pone.0065854. Print 2013. PLoS One. 2013. PMID: 23776558 Free PMC article. - Atherosclerosis and Alzheimer--diseases with a common cause? Inflammation, oxysterols, vasculature.
Lathe R, Sapronova A, Kotelevtsev Y. Lathe R, et al. BMC Geriatr. 2014 Mar 21;14:36. doi: 10.1186/1471-2318-14-36. BMC Geriatr. 2014. PMID: 24656052 Free PMC article. Review. - Advances in recent patent and clinical trial drug development for Alzheimer's disease.
Liu H, Wang L, Su W, Xie XQ. Liu H, et al. Pharm Pat Anal. 2014 Jul;3(4):429-47. doi: 10.4155/ppa.14.22. Pharm Pat Anal. 2014. PMID: 25291315 Free PMC article. Review. - Noninvasive characterization of Alzheimer's disease by circulating, cell-free messenger RNA next-generation sequencing.
Toden S, Zhuang J, Acosta AD, Karns AP, Salathia NS, Brewer JB, Wilcock DM, Aballi J, Nerenberg M, Quake SR, Ibarra A. Toden S, et al. Sci Adv. 2020 Dec 9;6(50):eabb1654. doi: 10.1126/sciadv.abb1654. Print 2020 Dec. Sci Adv. 2020. PMID: 33298436 Free PMC article. - Gene networks and microRNAs implicated in aggressive prostate cancer.
Wang L, Tang H, Thayanithy V, Subramanian S, Oberg AL, Cunningham JM, Cerhan JR, Steer CJ, Thibodeau SN. Wang L, et al. Cancer Res. 2009 Dec 15;69(24):9490-7. doi: 10.1158/0008-5472.CAN-09-2183. Cancer Res. 2009. PMID: 19996289 Free PMC article.
References
- Chen Y, Zhu J, Lum PY, Yang X, Pinto S, MacNeil DJ, Zhang C, Lamb J, Edwards S, Sieberts SK, Leonardson A, Castellini LW, Wang S, Champy MF, Zhang B, Emilsson V, Doss S, Ghazalpour A, Horvath S, Drake TA, Lusis AJ, Schadt EE. Variations in DNA elucidate molecular networks that cause disease. Nature. 2008;452:429–435. - PMC - PubMed
- Ruan J, Zhang W. Systems Biology and Computational Proteomics. Berlin/Heidelberg: Springer; 2007. Identification and evaluation of functional modules in gene co-expression networks. pp. 57–76. [Lecture Notes in Computer Science, volume 4532]
- Ruan J, Zhang W. Identifying network communities with a high resolution. Phys Rev E Stat Nonlin Soft Matter Phys. 2008:016104. - PubMed
Publication types
MeSH terms
Substances
LinkOut - more resources
Full Text Sources
Medical
Molecular Biology Databases
Miscellaneous


