SAP-controlled T-B cell interactions underlie germinal centre formation - PubMed (original) (raw)
SAP-controlled T-B cell interactions underlie germinal centre formation
Hai Qi et al. Nature. 2008.
Abstract
Generation of long-term antibody-mediated immunity depends on the germinal centre reaction, which requires cooperation between antigen-specific T and B lymphocytes. In human X-linked lymphoproliferative disease and its gene-targeted mouse model, loss-of-function mutations in signalling lymphocyte activation molecule-associated protein (SAP, encoded by SH2D1a) cause a profound defect in germinal centre formation by an as yet unknown mechanism. Here, using two-photon intravital imaging, we show that SAP deficiency selectively impairs the ability of CD4(+) T cells to stably interact with cognate B cells but not antigen-presenting dendritic cells. This selective defect results in a failure of antigen-specific B cells to receive adequate levels of contact-dependent T-cell help to expand normally, despite Sap(-/-) T cells exhibiting the known characteristics of otherwise competent helper T cells. Furthermore, the lack of stable interactions with B cells renders Sap(-/-) T cells unable to be efficiently recruited to and retained in a nascent germinal centre to sustain the germinal centre reaction. These results offer an explanation for the germinal centre defect due to SAP deficiency and provide new insights into the bi-directional communication between cognate T and B cells in vivo.
Figures
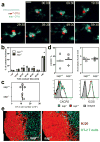
Figure 1. _Sap_−/− T cells normally interact with and are activated by DCs in vivo
a, Time-lapse images of sap+/+ and _sap_−/− OT-2 T cells interacting with OVA323-pulsed DCs in vivo (see also Supplementary Movie 1). Scale bar=10 μm. b, Distribution of T-DC contact durations (circles: individual experiments; bars: means). A total of 232 and 224 contacts were scored for sap+/+ and _sap_−/− T cells, respectively. c, d, e, T cell activation phenotypes 96 hours after transfer into recipients of OVA323-pulsed DCs. Absolute numbers of OT-2 cells (c) and typical patterns of CXCR5 and ICOS expression (d). Individual symbols: mean of 3–4 mice/group/experiment; Lines: mean of the 3 experiments. (e) The distribution of activated T cells in B cell follicles, representative of three experiments. Scale bar=100 μm.
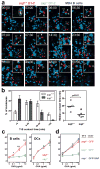
Figure 2. _Sap_−/− T cells are defective in adhesion to cognate B cells
a, Time-lapse images of sap+/+ and _sap_−/− T cells interacting with MD4 B cells 24–36 hours following HEL-OVA immunization. Circle: a cell cluster composed of one sap+/+ and one _sap_−/− T cell in contact with the same MD4 B cell at time zero. Solid arrowheads follow the two T cells, and open arrowheads highlight the B cell. Inserts: the MD4 cell and its immediate surrounding (see also Supplementary Movie 2). Scale bar=20 μm. b, Left, distribution of contact durations between T cells and MD4 B cells (mean±SEM of 5 experiments; 190 and 173 contacts scored for sap+/+ and _sap_−/− T cells, respectively). Right, the median durations of T-B contacts measured in individual experiments. Line: mean of the 5 medians. c, Conjugation efficiency of sap+/+ or _sap_−/− OT-2 T cells with OVA323-pulsed B cells or DCs, expressed as mean±SEM frequencies of CD4+CD19+ or CD4+CD11c+ conjugates in total CD4+ events (5 experiments, * p<0.05, *** p<0.001; see representative cytometry plots in Supplementary Fig. 1). . d, T-B conjugation assays were conducted using OT-2 cells transiently transfected with DNA constructs expressing either GFP or GFP-tagged SAP as indicated. Frequencies measured in 6 independent experiments are presented as mean±SEM (also see Supplementary Fig. 1).
Figure 3. B cells fail to receive contact-dependent help from SAP-deficient T cells
a, Individual T-B contact durations (left) and their distribution (right). The non-cognate condition involves sap+/+ OT-2 cells non-specifically interacting with MD4 B cells following immunization with HEL-BSA mixed with OVA protein (137 measurements from 2 experiments). The cognate condition involves specific interactions between sap+/+ or _sap_−/− OT-2 T cells and MD4 B cells following immunization with HEL-OVA (380 and 390 measurements from 3 experiments). b, c, d, Individual MD4 B cells were tracked for their cumulative interactions with OT-2 T cells over 3 hours. b, Examples of tracked MD4 cells (arrowheads). The MD4 cells represented by white tracks divided during the imaging period, giving rise to two daughter cells represented by red tracks. c, Interaction histories of the MD4 cells in (b) are plotted in the line-box graphs. Vertical lines indicate the periods during which the B cells were present in the imaged volume. Arrows indicate cell divisions giving rise to daughter cells. Each box represents one contact with a T cell, and its height indicates the contact duration (see also Supplementary Movie 5). d, A total of 82 MD4 cells in each condition were tracked in 3 experiments. Each MD4 B cell is plotted as one bar. The bar height is the sum of all T cell contacts (top) or only those contacts that were not shorter than 3 minutes (bottom), a cut-off differentiating cognate from non-cognate T-B interactions with a 95% confidence as determined in (a). e, f, MD4 B cells (7-AAD−CD19+IgMa+CD4−GFP− singlet events) and OT-2 T cells (7-AAD−CD19−CD4+GFP+ singlet events) were analyzed by FACS in 3 experiments at 96 hours post HEL-OVA immunization. Individual symbols: mean of 3–4 mice/group/experiment; Lines: mean of the 3 experiments. e, Cell expansion. Top, numbers of MD4 cells recovered after co-transfer of sap+/+ or _sap_−/− OT-2 T cells were normalized against the number obtained where no exogenous OT-2 cells were co-transferred (dotted line at unit 1). Bottom, absolute numbers of recovered OT-2 cells under the condition of co-transfer with B cells. f, Surface expression of CXCR5, CD40L, ICOS, and OX40 by the two types of OT-2 T cells. See Online Methods for details of quantitative analysis and Supplementary Fig. 4 for representative cytometry plots.
Figure 4. Defective GC recruitment and retention of _sap_−/− T cells due to lack of efficient cognate interactions with B cells
a, Typical migration patterns of sap+/+ (red) and _sap_−/− (green) OT-2 T cells in follicles containing cognate GCs. Left: the naïve B cell-dominated follicular mantle zone and its encased GC area (see Supplementary Fig. 6 for details of this 3-D rendering); Middle: the distribution of migration tracks of the two types of T cells; Right: an overlay with the mantle zone rendered as semi-transparent (see also Supplementary Movie 6). b, The GC surface retrieved from the dataset in (a) is rendered semi-transparent in 3 different orientations together with examples of 5 T cell tracks that differentially interacted with this surface. Tracks are labelled at their temporal beginnings. Arrowheads highlight the positions at which tracks cross the GC surface. c, Migration patterns of sap+/+ and _sap_−/− T cells that arrived at a 10 μm-wide virtual mantle-GC interface zone. The area between the two dotted circles represents the 10 μm-wide interface zone; the inner circle represents the GC surface, while area outside of the outer circle is the follicular mantle. The blue line segment indicates the region in which a track began, i.e. the mantle zone (top) or the GC (bottom). The number in blue is the total number of tracks of the indicated type analyzed. The three red arrows denote tracks that subsequently moved into the mantle zone, stayed within the interface zone, or moved into the GC area, respectively. Corresponding numbers denote percentages of tracks of each genotype that exhibited the indicated behaviour. Data are pooled from 3 experiments. d, e, f, Migration of sap+/+ and _sap_−/− OT-2 T cells in follicles containing non-cognate GCs. d, A schematic diagram for the protocol used to generate GCs that are non-cognate to the OT-2 cells activated in the same LN. e, In the same configuration as in (a), typical migration patterns of the two types of T cells (see also Supplementary Movie 7). f, T cells tracks that came within 10 μm from non-cognate GCs were analyzed for their subsequent migrations using the same method as used in (c). Data from 2 experiments are pooled.
Comment in
- Immunology: Helpful T cells are sticky.
Deenick EK, Tangye SG. Deenick EK, et al. Nature. 2008 Oct 9;455(7214):745-7. doi: 10.1038/455745a. Nature. 2008. PMID: 18843357 No abstract available.
Similar articles
- Immunology: Helpful T cells are sticky.
Deenick EK, Tangye SG. Deenick EK, et al. Nature. 2008 Oct 9;455(7214):745-7. doi: 10.1038/455745a. Nature. 2008. PMID: 18843357 No abstract available. - SAP-regulated T Cell-APC adhesion and ligation-dependent and -independent Ly108-CD3ζ interactions.
Chu C, Wang Y, Zhang X, Ni X, Cao J, Xu W, Dong Z, Yuan P, Wei W, Ma Y, Zhang L, Wu L, Qi H. Chu C, et al. J Immunol. 2014 Oct 15;193(8):3860-71. doi: 10.4049/jimmunol.1401660. Epub 2014 Sep 12. J Immunol. 2014. PMID: 25217164 - SAP regulation of follicular helper CD4 T cell development and humoral immunity is independent of SLAM and Fyn kinase.
McCausland MM, Yusuf I, Tran H, Ono N, Yanagi Y, Crotty S. McCausland MM, et al. J Immunol. 2007 Jan 15;178(2):817-28. doi: 10.4049/jimmunol.178.2.817. J Immunol. 2007. PMID: 17202343 - SLAM receptors and SAP influence lymphocyte interactions, development and function.
Schwartzberg PL, Mueller KL, Qi H, Cannons JL. Schwartzberg PL, et al. Nat Rev Immunol. 2009 Jan;9(1):39-46. doi: 10.1038/nri2456. Nat Rev Immunol. 2009. PMID: 19079134 Review.
Cited by
- Mechanisms underlying helper T-cell plasticity: implications for immune-mediated disease.
Hirahara K, Poholek A, Vahedi G, Laurence A, Kanno Y, Milner JD, O'Shea JJ. Hirahara K, et al. J Allergy Clin Immunol. 2013 May;131(5):1276-87. doi: 10.1016/j.jaci.2013.03.015. J Allergy Clin Immunol. 2013. PMID: 23622118 Free PMC article. Review. - Negative Regulation of Humoral Immunity Due to Interplay between the SLAMF1, SLAMF5, and SLAMF6 Receptors.
Wang N, Halibozek PJ, Yigit B, Zhao H, O'Keeffe MS, Sage P, Sharpe A, Terhorst C. Wang N, et al. Front Immunol. 2015 Apr 14;6:158. doi: 10.3389/fimmu.2015.00158. eCollection 2015. Front Immunol. 2015. PMID: 25926831 Free PMC article. - Cbl and Cbl-b control the germinal center reaction by facilitating naive B cell antigen processing.
Li X, Gong L, Meli AP, Karo-Atar D, Sun W, Zou Y, King IL, Gu H. Li X, et al. J Exp Med. 2020 Sep 7;217(9):e20191537. doi: 10.1084/jem.20191537. J Exp Med. 2020. PMID: 32584413 Free PMC article. - Regulation of B cell responses by distinct populations of CD4 T cells.
Aloulou M, Fazilleau N. Aloulou M, et al. Biomed J. 2019 Aug;42(4):243-251. doi: 10.1016/j.bj.2019.06.002. Epub 2019 Sep 26. Biomed J. 2019. PMID: 31627866 Free PMC article. Review. - Cytokines in the Germinal Center Niche.
Jandl C, King C. Jandl C, et al. Antibodies (Basel). 2016 Feb 5;5(1):5. doi: 10.3390/antib5010005. Antibodies (Basel). 2016. PMID: 31557986 Free PMC article. Review.
References
- Coico RF, Bhogal BS, Thorbecke GJ. Relationship of germinal centers in lymphoid tissue to immunologic memory. VI Transfer of B cell memory with lymph node cells fractionated according to their receptors for peanut agglutinin. J Immunol. 1983;131:2254–2257. - PubMed
- Berek C, Berger A, Apel M. Maturation of the immune response in germinal centers. Cell. 1991;67:1121–1129. - PubMed
- Jacob J, Kelsoe G, Rajewsky K, Weiss U. Intraclonal generation of antibody mutants in germinal centres. Nature. 1991;354:389–392. - PubMed
- MacLennan IC, et al. The changing preference of T and B cells for partners as T-dependent antibody responses develop. Immunol Rev. 1997;156:53–66. - PubMed
- Raff MC. Role of thymus-derived lymphocytes in the secondary humoral immune response in mice. Nature. 1970;226:1257–1258. - PubMed
Publication types
MeSH terms
Substances
LinkOut - more resources
Full Text Sources
Other Literature Sources
Molecular Biology Databases
Research Materials
Miscellaneous


