Mechanism of alcohol-induced oxidative stress and neuronal injury - PubMed (original) (raw)
Mechanism of alcohol-induced oxidative stress and neuronal injury
James Haorah et al. Free Radic Biol Med. 2008.
Abstract
Neuro-cognitive deficits, neuronal injury, and neurodegeneration are well documented in alcoholics, yet the underlying mechanisms remain elusive. Oxidative damage of mitochondria and cellular proteins intertwines with the progression of neuroinflammation and neurological disorders initiated by alcohol abuse. Here, we present the evidence that metabolism of ethanol in primary human neurons by alcohol dehydrogenase (ADH) or cytochrome P450-2E1 (CYP2E1) generates reactive oxygen species (ROS) and nitric oxide (NO) via induction of NADPH/xanthine oxidase (NOX/XOX) and nitric oxide synthase (NOS) in human neurons. The acetaldehyde-mediated increase in NOX, XOX, or NOS activity is regulated as a transcriptional rather than a translational process. Marked increase in the lipid peroxidation product (4-hydroxynonenal) and enhanced ROS generation coincides with decreased neuronal viability and diminished expression of neuronal marker (neurofilaments). Novel quantitative methods of ROS and NO detection help dissect the mechanisms of alcohol-induced neurodegeneration. Uncovering the basic mechanisms of oxidative neuronal injury will serve as the basis for development of new therapies.
Figures
Fig. 1
EtOH induces CYP2E1 activity and protein expression in primary human neurons. Microsomal protein fraction from neurons was assayed for (A) CYP2E1 activity, (B) immunoreactive bands of CYP2E1 and actin, and (C) CYP2E1 protein content. Results were expressed as mean values (±SD; _n_=3), and presented as nmol/h/mg protein, or as ratio of CYP2E1 to that of actin-immunoreactive intensity. *Indicates statistical significance (P<0.01) compared with control. Primary neurons after exposure to 17.5 mM EtOH for 24 h were also analyzed for CYP2E1 protein expression: (D) control (E) EtOH. Immunofluorescence stains are DAPI (blue) and CYP2E1 (red). Original magnification ×20. (For interpretation of the references to colour in this figure legend, the reader is referred to the web version of this article.)
Fig. 2
Primary human neurons express ADH activity and protein. Cytosolic protein fraction from neurons was assayed for (A) ADH activity, (B) immunoreactive bands of ADH and actin, and (C) ADH protein content. Results were expressed as mean values (±SD; _n_=3), and presented as nmol/h/mg protein, or as ratio of ADH to that of actin-immunoreactive intensity. *Indicates statistical significance (P<0.01) compared with control. Neuronal immunofluorescent stainings of (D) control and (E) EtOH. DAPI (blue), and ADH (green). Original magnification ×20. (For interpretation of the references to colour in this figure legend, the reader is referred to the web version of this article.)
Fig. 3
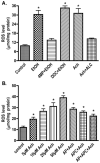
Treatment of neurons with 17.5 mM EtOH or Ach significantly increases ROS production detected by DCF-DA assays using 96-well Fluoroblock plates. (A) Effects of EtOH and specific inhibitors (B) Ach dose-dependent ROS production via NOX/XOX induction. Results were expressed as mean values (±SD; _n_=3). *Indicates statistical significance (P<0.01) compared with controls. APC (apocynin, NOX inhibitor), AP (allopurinol, XOX inhibitor), 4MP (4-methylpyrazole, ADH/CYP2E1 inhibitor), ALC (acetyl-L-carnitine, mitochondrial fatty acid transporter, neurotransmitter, and antioxidant), DDC (diethyldithiocarbamate, SOD inhibitor).
Fig. 4
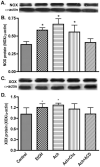
EtOH/Ach elevates NOX and XOX protein levels in human neurons. Neuronal protein extracts derived from EtOH/Ach (17.5 mM/10 μM) treatment for 48 h were assayed for changes in NOX or XOX protein content. (A) Immunoreactive bands of NOX and actin, (B) NOX protein content, (C) immunoreactive bands of XOX and actin, and (D) XOX protein content. Results were expressed as mean values (±SD; _n_=3), and presented as ratio of NOX or XOX to that of actin-immunoreactive bands. *Indicates statistical significance (P<0.01) compared with controls. Cyclohexamide (Chx; protein synthesis inhibitor), and actinomycin D (ACD; inhibitor of RNA synthesis).
Fig. 5
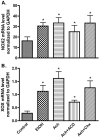
EtOH/Ach up-regulates mRNA levels of NOX and XOX in human neurons. RNA extracts derived from EtOH/Ach treatment for 48 h were quantified by real-time PCR techniques. (A) mRNA levels of NOX, and (B) mRNA levels of XOX. Results were normalized to GAPDH and expressed as mean values (±SD; _n_=3). *Indicates statistical differences (P<0.01) compared with control. Chx (protein synthesis inhibitor, 10 μg/ml), and ACD (inhibitor of RNA synthesis, 100 ng/ml).
Fig. 6
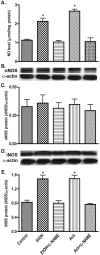
Enhanced NO production due to iNOS induction by EtOH/Ach exposure. (A) NO level was detected by diaminofluorescein-2 diacetate (DAF-2DA) assay in 96-well plate cultured neurons. Neuronal lysates protein (20 μg/well) was used for Western blot analyses. (B) Immunoreactive bands of nNOS and actin protein, (C) nNOS protein content, (D) immunoreactive bands of iNOS and actin protein, and (E) iNOS protein content. Results were expressed as mean values (±SD; _n_=3), and presented as μmol/mg cellular protein (for NO), or as ratio of nNOS or iNOS to that of actin-immunoreactive bands. *Indicates statistical significance (P<0.01) compared with controls. L-NAME (100 μM, _N_G-nitro-L-arginine methyl ester, NOS inhibitor).
Fig. 7
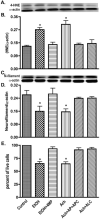
EtOH/Ach causes oxidative damage and neuronal injury. Lysate protein (20 μg/well) derived from EtOH/Ach (17.5 mM/10 μM) treatment for 72 h was analyzed by Western blot for changes in protein content. (A) Immunoreactive bands of 4-HNE and actin, (B) 4-HNE protein content, (C) immunoreactive bands of neurofilament and actin, and (D) neurofilament protein content. (E) Neuronal Live/Dead assay determines the loss of neurons from EtOH/Ach (17.5 mM/10 μM) treatment for 72 h. Results were expressed as ratio of 4-HNE or neurofilaments to that of actin bands, or percentage of live cells for neuronal loss (mean values ±SD; _n_=3). *Indicates statistical significance (P<0.01) compared with controls.
Fig. 8
Alcohol-induced activation of oxidative pathways in the CNS leading to neurodegeneration.
Similar articles
- Ethanol metabolism by alcohol dehydrogenase or cytochrome P450 2E1 differentially impairs hepatic protein trafficking and growth hormone signaling.
Doody EE, Groebner JL, Walker JR, Frizol BM, Tuma DJ, Fernandez DJ, Tuma PL. Doody EE, et al. Am J Physiol Gastrointest Liver Physiol. 2017 Dec 1;313(6):G558-G569. doi: 10.1152/ajpgi.00027.2017. Epub 2017 Sep 1. Am J Physiol Gastrointest Liver Physiol. 2017. PMID: 28864499 Free PMC article. - Mitochondrial oxidative stress and CD95 ligand: a dual mechanism for hepatocyte apoptosis in chronic alcoholism.
Miñana JB, Gómez-Cambronero L, Lloret A, Pallardó FV, Del Olmo J, Escudero A, Rodrigo JM, Pellíin A, Viña JR, Viña J, Sastre J. Miñana JB, et al. Hepatology. 2002 May;35(5):1205-14. doi: 10.1053/jhep.2002.32969. Hepatology. 2002. PMID: 11981771 - In vitro evidence for chronic alcohol and high glucose mediated increased oxidative stress and hepatotoxicity.
Chandrasekaran K, Swaminathan K, Mathan Kumar S, Clemens DL, Dey A. Chandrasekaran K, et al. Alcohol Clin Exp Res. 2012 Jun;36(6):1004-12. doi: 10.1111/j.1530-0277.2011.01697.x. Epub 2012 Feb 6. Alcohol Clin Exp Res. 2012. PMID: 22309822 - Alcohol and oxidative liver injury.
Dey A, Cederbaum AI. Dey A, et al. Hepatology. 2006 Feb;43(2 Suppl 1):S63-74. doi: 10.1002/hep.20957. Hepatology. 2006. PMID: 16447273 Review. - Acetaldehyde generating enzyme systems: roles of alcohol dehydrogenase, CYP2E1 and catalase, and speculations on the role of other enzymes and processes.
Crabb DW, Liangpunsakul S. Crabb DW, et al. Novartis Found Symp. 2007;285:4-16; discussion 16-22, 198-9. doi: 10.1002/9780470511848.ch2. Novartis Found Symp. 2007. PMID: 17590984 Review.
Cited by
- Oxidative stress, unfolded protein response, and apoptosis in developmental toxicity.
Kupsco A, Schlenk D. Kupsco A, et al. Int Rev Cell Mol Biol. 2015;317:1-66. doi: 10.1016/bs.ircmb.2015.02.002. Epub 2015 Mar 11. Int Rev Cell Mol Biol. 2015. PMID: 26008783 Free PMC article. Review. - Alcohol Binge Drinking Selectively Stimulates Protein S-Glutathionylation in Aorta and Liver of ApoE -/- Mice.
Seidel K, Wan X, Zhang M, Zhou Y, Zang M, Han J. Seidel K, et al. Front Cardiovasc Med. 2021 Mar 16;8:649813. doi: 10.3389/fcvm.2021.649813. eCollection 2021. Front Cardiovasc Med. 2021. PMID: 33796575 Free PMC article. - Drinking patterns, alcoholic beverage types, and esophageal cancer risk in Africa: a comprehensive systematic review and meta-analysis.
Ndebia EJ, Kamsu GT. Ndebia EJ, et al. Front Oncol. 2023 Dec 21;13:1310253. doi: 10.3389/fonc.2023.1310253. eCollection 2023. Front Oncol. 2023. PMID: 38188303 Free PMC article. Review. - Single-cell ELISA and flow cytometry as methods for highlighting potential neuronal and astrocytic toxicant specificity.
Woehrling EK, Hill EJ, Torr EE, Coleman MD. Woehrling EK, et al. Neurotox Res. 2011 Apr;19(3):472-83. doi: 10.1007/s12640-010-9202-2. Epub 2010 Jun 15. Neurotox Res. 2011. PMID: 20552314 - Subventricular zone neural precursor cell responses after traumatic brain injury and binge alcohol in male rats.
Ton ST, Tsai SY, Vaagenes IC, Glavin K, Wu J, Hsu J, Flink HM, Nockels D, O'Brien TE, Kartje GL. Ton ST, et al. J Neurosci Res. 2019 May;97(5):554-567. doi: 10.1002/jnr.24382. Epub 2019 Jan 7. J Neurosci Res. 2019. PMID: 30614539 Free PMC article.
References
- Parsons OA. Neurocognitive deficits in alcoholics and social drinkers: a continuum? Alcohol. Clin. Exp. Res. 1998;22:954–961. - PubMed
- Zeigler DW, Wang CC, Yoast RA, Dickinson BD, McCaffree MA, Robinowitz CB, et al. The neurocognitive effects of alcohol on adolescents and college students. Prev. Med. 2005;40:23–32. - PubMed
- Harper C. The neuropathology of alcohol-specific brain damage, or does alcohol damage the brain? J. Neuropathol. Exp. Neurol. 1998;57:101–110. - PubMed
- Lin MT, Beal MF. Mitochondrial dysfunction and oxidative stress in neurodegenerative diseases. Nature. 2006;443:787–795. - PubMed
- Maracchioni A, Totaro A, Angelini DF, Di Penta A, Bernardi G, Carri MT, et al. Mitochondrial damage modulates alternative splicing in neuronal cells: implications for neurodegeneration. J. Neurochem. 2007;100:142–153. - PubMed
Publication types
MeSH terms
Substances
Grants and funding
- R21 AA016403-01A2/AA/NIAAA NIH HHS/United States
- AA 015913/AA/NIAAA NIH HHS/United States
- AA 016403/AA/NIAAA NIH HHS/United States
- AA 017398/AA/NIAAA NIH HHS/United States
- R37 AA015913/AA/NIAAA NIH HHS/United States
- R01 AA017398-01/AA/NIAAA NIH HHS/United States
- R01 AA017398/AA/NIAAA NIH HHS/United States
- R21 AA016403/AA/NIAAA NIH HHS/United States
- R01 AA015913/AA/NIAAA NIH HHS/United States
LinkOut - more resources
Full Text Sources
Other Literature Sources


