Probabilistic base calling of Solexa sequencing data - PubMed (original) (raw)
Probabilistic base calling of Solexa sequencing data
Jacques Rougemont et al. BMC Bioinformatics. 2008.
Abstract
Background: Solexa/Illumina short-read ultra-high throughput DNA sequencing technology produces millions of short tags (up to 36 bases) by parallel sequencing-by-synthesis of DNA colonies. The processing and statistical analysis of such high-throughput data poses new challenges; currently a fair proportion of the tags are routinely discarded due to an inability to match them to a reference sequence, thereby reducing the effective throughput of the technology.
Results: We propose a novel base calling algorithm using model-based clustering and probability theory to identify ambiguous bases and code them with IUPAC symbols. We also select optimal sub-tags using a score based on information content to remove uncertain bases towards the ends of the reads.
Conclusion: We show that the method improves genome coverage and number of usable tags as compared with Solexa's data processing pipeline by an average of 15%. An R package is provided which allows fast and accurate base calling of Solexa's fluorescence intensity files and the production of informative diagnostic plots.
Figures
Figure 1
Signal and noise in fluorescence intensities. Representation of the first cycle of synthesis on five concatenated tiles of the phiX174 sequencing data. A. Projection of the intensity quadruples on the axes corresponding to the A and C channels and the G and T channels at cycles 1 an 15. The ellipses represent the Gaussian mixtures (centers and the line for one standard deviation are shown). B. Same data after de-correlation transformations (see Methods). Coloring reflects the mixture component with largest probability.
Figure 2
Base calling determined by entropy. A. Probability simplex for a 3-letter alphabet (A = blue, C = red, G = green). Each point in the triangle is a probability triplet (_P_A, _P_C, P_G) represented by the corresponding color mixture. Blue lines are iso-entropic levels, black lines are the cutoffs between the various IUPAC codes. These correspond to midpoints in the state variable (S = 2_h). B. Distribution of entropy per base across 10 tiles on 36 bases. Red lines at the bottom indicate the IUPAC cutoffs. Mass within each segment is indicated in red.
Figure 3
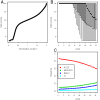
Quality and entropy depend on position in the sequence. A. Quantile-quantile plot of fast-q quality score against the information content per base. The two measures are loosely correlated, but clearly not equivalent. B. Boxplot of the fast-q score along the first 35 bases of the sequencing. The overall base quality decreases sharply after base 14, but the distribution still extends up to the top 40 score at bases 30–35. C. Frequency of the four categories of ambiguous IUPAC codes as a function of the position in the sequence.
Figure 4
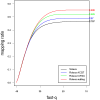
Rolexa base-calling increases the coverage. Black: Solexa base calling, blue: Rolexa base calling using only the ACGT alphabet (most probable base calling), green: Rolexa base calling using IUPAC codes, red: Rolexa base calling with IUPAC codes and tag length optimization. Numbers in the right margin are the number of matching tags in millions. Sequence tags were sorted by decreasing quality (fast-q) and unique exact matches on the reference phiX174 genome were searched. Vertical axis shows the proportion of tags finding an exact match.
Figure 5
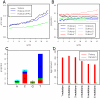
Disequilibrium between complementary bases ratio. A. Error rate at each cycle of sequencing. Each tag was aligned on the genome using align0 and the error rate defined by counting the number of differences between the bases called and the reference at the corresponding position. Black is the error rate for Solexa-called tags, blue for Rolexa tags called using only the ACGT alphabet and green for Rolexa-called tags with IUPAC codes. B. Proportion of bases A, C, G and T at each position in the tags for Solexa base calling (dashed lines) and Rolexa base calling (continuous line). The complementary A and T proportions are different (ratio is not 1) and are degrading along the sequences (lines drift apart). The proportions are less dependent on position with Rolexa base calling, although the ratios remain different from 1. Label on y-axis is wrong. Panels C-D focuses on tags "rescued" by Rolexa base calling, namely those tags that could not be mapped on the genome after Solexa base calling, but had a matching position via Rolexa base calling. C. The distribution of substitutions between the Solexa tags and the corresponding Rolexa tags shows a predominance of C to A and T to G substitutions which is consistent with a re-equilibration of the base complementarity.D. Introducing one to six mutations in the Solexa tags with the same frequencies as the Rolexa algorithm at random positions only rescues about 2% of the tags that were rescued by Rolexa with the same number of ambiguous bases (green bars).
Figure 6
Tag-dependent quality filtering improves the mapping efficiency. Several entropy cutoffs were used to filter low-quality Rolexa-called tags and to reduce tags to higher scoring sub-tags. Solexa-called tags were filtered to the same length as the average length of the previous sets and to various average fast-q score. A. The actual coverage of the target genome as a function of the expected coverage (if all tags could have been mapped). B. The efficiency of the filtering in coverage ratio (actual number of nucleotides covered divided by expected number, X axis) and in tag mapping ratio (number of tags mapped to the genome divided by number of tags passing the quality filter, Y axis). Rolexa (red points) has superior efficiency to Solexa (green points) in all data sets. Points are labeled with the cutoffs used (see text): Rolexa cutoffs are either constant (2, 4, 6, 8), growing logarithmically (Log) or exponentially (Exp), Solexa cutoffs are indicated by two numbers, the length cutoff followed by the fast-q cutoff.
Similar articles
- Analysis of the prostate cancer cell line LNCaP transcriptome using a sequencing-by-synthesis approach.
Bainbridge MN, Warren RL, Hirst M, Romanuik T, Zeng T, Go A, Delaney A, Griffith M, Hickenbotham M, Magrini V, Mardis ER, Sadar MD, Siddiqui AS, Marra MA, Jones SJ. Bainbridge MN, et al. BMC Genomics. 2006 Sep 29;7:246. doi: 10.1186/1471-2164-7-246. BMC Genomics. 2006. PMID: 17010196 Free PMC article. - Optimal spliced alignments of short sequence reads.
De Bona F, Ossowski S, Schneeberger K, Rätsch G. De Bona F, et al. Bioinformatics. 2008 Aug 15;24(16):i174-80. doi: 10.1093/bioinformatics/btn300. Bioinformatics. 2008. PMID: 18689821 - BING: biomedical informatics pipeline for Next Generation Sequencing.
Kriseman J, Busick C, Szelinger S, Dinu V. Kriseman J, et al. J Biomed Inform. 2010 Jun;43(3):428-34. doi: 10.1016/j.jbi.2009.11.003. Epub 2009 Nov 28. J Biomed Inform. 2010. PMID: 19925883 - De novo sequencing of plant genomes using second-generation technologies.
Imelfort M, Edwards D. Imelfort M, et al. Brief Bioinform. 2009 Nov;10(6):609-18. doi: 10.1093/bib/bbp039. Brief Bioinform. 2009. PMID: 19933209 Review. - The new paradigm of flow cell sequencing.
Holt RA, Jones SJ. Holt RA, et al. Genome Res. 2008 Jun;18(6):839-46. doi: 10.1101/gr.073262.107. Genome Res. 2008. PMID: 18519653 Review.
Cited by
- Swift: primary data analysis for the Illumina Solexa sequencing platform.
Whiteford N, Skelly T, Curtis C, Ritchie ME, Löhr A, Zaranek AW, Abnizova I, Brown C. Whiteford N, et al. Bioinformatics. 2009 Sep 1;25(17):2194-9. doi: 10.1093/bioinformatics/btp383. Epub 2009 Jun 23. Bioinformatics. 2009. PMID: 19549630 Free PMC article. - Quake: quality-aware detection and correction of sequencing errors.
Kelley DR, Schatz MC, Salzberg SL. Kelley DR, et al. Genome Biol. 2010;11(11):R116. doi: 10.1186/gb-2010-11-11-r116. Epub 2010 Nov 29. Genome Biol. 2010. PMID: 21114842 Free PMC article. - Whole genome sequencing of Saccharomyces cerevisiae: from genotype to phenotype for improved metabolic engineering applications.
Otero JM, Vongsangnak W, Asadollahi MA, Olivares-Hernandes R, Maury J, Farinelli L, Barlocher L, Osterås M, Schalk M, Clark A, Nielsen J. Otero JM, et al. BMC Genomics. 2010 Dec 22;11:723. doi: 10.1186/1471-2164-11-723. BMC Genomics. 2010. PMID: 21176163 Free PMC article. - GenHtr: a tool for comparative assessment of genetic heterogeneity in microbial genomes generated by massive short-read sequencing.
Yu G. Yu G. BMC Bioinformatics. 2010 Oct 12;11:508. doi: 10.1186/1471-2105-11-508. BMC Bioinformatics. 2010. PMID: 20939910 Free PMC article. - Statistical design and analysis of RNA sequencing data.
Auer PL, Doerge RW. Auer PL, et al. Genetics. 2010 Jun;185(2):405-16. doi: 10.1534/genetics.110.114983. Epub 2010 May 3. Genetics. 2010. PMID: 20439781 Free PMC article.
References
Publication types
MeSH terms
Substances
LinkOut - more resources
Full Text Sources
Other Literature Sources


