The endoderm of the mouse embryo arises by dynamic widespread intercalation of embryonic and extraembryonic lineages - PubMed (original) (raw)
The endoderm of the mouse embryo arises by dynamic widespread intercalation of embryonic and extraembryonic lineages
Gloria S Kwon et al. Dev Cell. 2008 Oct.
Abstract
The cell movements underlying the morphogenesis of the embryonic endoderm, the tissue that will give rise to the respiratory and digestive tracts, are complex and not well understood. Using live imaging combined with genetic labeling, we investigated the cell behaviors and fate of the visceral endoderm during gut endoderm formation in the mouse gastrula. Contrary to the prevailing view, our data reveal no mass displacement of visceral endoderm to extraembryonic regions concomitant with the emergence of epiblast-derived definitive endoderm. Instead, we observed dispersal of the visceral endoderm epithelium and extensive mixing between cells of visceral endoderm and epiblast origin. Visceral endoderm cells remained associated with the epiblast and were incorporated into the early gut tube. Our findings suggest that the segregation of extraembryonic and embryonic tissues within the mammalian embryo is not as strict as believed and that a lineage previously defined as exclusively extraembryonic contributes cells to the embryo.
Figures
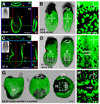
Figure 1. Genetic-labeling and live imaging endoderm morphogenesis
(A and B) At the onset of gastrulation, the visceral endoderm encapsulates the epiblast and extraembryonic ectoderm. (A) Orthogonal sections through an E6.5 (MS stage) embryo. (B) 3D reconstruction of _z_-stack shown in A projected as a lateral (left) and posterior (right) view. (C and D) By E7.5 (EB stage) visceral endoderm cells overlying the extraembryonic ectoderm form a contiguous sheet of cells and are sparsely distributed overlying the epiblast. (C) Orthogonal sections reveal contiguous GFP fluorescence overlying the extraembryonic ectoderm (outlined by orange arrowheads) and interrupted GFP fluorescence overlying the distally positioned epiblast and its derivatives (outlined by blue arrowheads). (D) 3D reconstruction of _z_-stack shown in C projected as a lateral (left) and a posterior (right) view. (E) High magnification view of a region on the left lateral side of the embryo and (F) overlying the primitive streak. (G) 3D reconstruction of a _z_-stack taken though an E8.25 (ESom stage) embryo, projected as lateral (left), and posterior (center), and ventral views (right (H) High magnification views of the region around node. Red dots correspond to the position of the amnion, the morphological landmark of the boundary between the extraembryonic and embryonic part of the conceptus. ys, yolk sac; Pr, proximal; D, distal; A, anterior; P, posterior; L, left; R, right. Scale bars = 100 µm in A; 200 µm in C and G; 50 µm in E, F, and H.
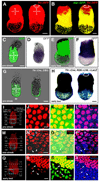
Figure 2. Fluorescent proteins as cell tracers in visceral endoderm derived cells that are downregulating marker genes
(A and B) Two distinct visceral endoderm-specific _cis_-regulatory elements identify the same population of cells. (A) 3D reconstruction of _z_-stack acquired from an EB stage (E7.5) Ttr::RFPTg/+ transgenic projected laterally (left) and posteriorly (right). (B) 3D reconstruction of _z_-stack from an Afp::GFPTg/+; Ttr::RFPTg/+ transgenic projected laterally (left) and posteriorly (right). Co-expressing cells are yellow. (C–F) Localization of GFP protein (green fluorescence, C and E) and mRNA (blue staining, D and F) in PS and EB stage Afp::GFPTg/+ embryos. (C and D) PS stage embryo imaged live for GFP protein (C), then processed for GFP mRNA in situ hybridization (D). (E and F) EB stage embryo imaged live (E), then processed for mRNA in situ hybridization (F). (G and H) Cre recombinase-mediated excision labels the entire visceral endoderm at PS stages in Ttr::CreTg/+ ; Z/EG embryos (green fluorescence, G), while visceral endoderm-derived cells overlying the epiblast is labeled in Ttr::CreTg/+ ; R26::LNL::LacZ+/− embryos at the EB stage (blue staining, H). IHC of PS stage (I–L), MS stage (M–P) and EB stage (Q–T) Afp::GFPTg/+ embryos. GFP (green), Hnf4α (red) and Hoechst (labeling nuclei - blue). (I, M and Q) 3D reconstructions of _z_-stacks quantifying Hnf4a expression in distinct regions of each embryo. Percentage of GFP+ cells that are also Hnf4a+ (left column); average fluorescence intensity of Hnf4a+ nuclei (right column). High-magnification 3D single and merged channel views of boxed regions (J–L, N–P and R–T). GFP+ cells with high levels of Hnf4α (blue arrowheads), GFP+ cells expressing reduced levels of Hnf4α (white arrowheads), GFP+ cells with no detectable Hnf4α (orange arrowheads). Pr, proximal; D, distal; A, anterior; P, posterior; L, left; R, right; 3D, 3-dimensions; 2D, 2-dimensions. Scale bars = 20 µm in J,N and R; 50 µm in C and G; 100 µm in A,B,E and H.
Figure 3. A scattered population of cells located in the surface layer of the embryo overlying the epiblast is not of epiblast origin
(A–H) 3D reconstructions of laser scanning confocal _z_-stacks taken through an LB stage XmXpGFP; Ttr::RFPTg/+ embryo. (E–H) High magnification views of boxed region. RFP+ cells all of which are located on the surface of the embryo (white arrowheads); GFP+ cells located on the surface of the embryo (orange arrowheads); GFP+ cells that are not superficially located (blue arrowheads). (I–L) EHF stage 4n CAG::RFPTg/+ <-> 2n R1 ES cell chimera. Schematic depicting the contribution of tetraploid and diploid compartments (I). Brightfield image (J), 3D reconstruction of _z_-stack of mages acquired in red fluorescent channel (K), and overlay (L). Dispersed population of 4n RFP+ cells overlying the epiblast (white arrowheads). Scale bars = 200 µm in A; 20 µm in E; 100 µm in J.
Figure 4. Dynamics of visceral endoderm cell dispersal
(A) Still images from 3D time-lapse movie (Supplementary movie 8) of an Afp::GFPTg/+ embryo from LS to EB stage. Red dots correspond to the position of the amnion, the morphological landmark of the boundary between the extraembryonic and embryonic part of the conceptus. Scale bar = 50µm. (B) Histograms depicting fluorescence area overlying the epiblast in ES (N=7), LS (N=6), OB (N=20), to LHF (N=5) stages. (C) Histograms depicting GFP+ cells overlying the epiblast at 10 somite (10S, N=9) stage.
Figure 5. Intercalation of epiblast-derived and visceral endoderm cells on the surface of the embryo
(A, D) Wholemount view of ES (A) and EB (D) stage embryos used for IHC to fibronectin. (B–C and E–F) 3D reconstruction of _z_-stacks in boxed region of A (B–C) or D (E–F), depicting a filamentous fibronectin network. Percentages in (B) and (E) depict density of fibronectin as quantified by positive area of red channel under equal threshold and magnification in the two embryonic stages. (G) yz view of EB stage Afp::GFPTg/+ embryo reveals a contiguous sheet of GFP+ cells covering the fibronectin matrix (red) on the surface. (H) yz view of LB stage Afp::GFPTg/+ embryo reveals intercalation of GFP+ and GFP− cells at the LB stage. Isolated GFP+ cells (white arrowheads); GFP− cells neighboring isolated GFP+ cells positioned on the same side of the fibronectin matrix (orange arrowheads). (I–K) 3D reconstructed _z_-stacks taken through the region overlying the epiblast of LB (E7.5) stage Afp::GFPTg/+ embryo visualized for ZO-1. Interfaces lacking ZO-1 (white arrowheads). (L–N) 3D reconstructed _z_-stacks through the region overlying the epiblast of LB (E7.5) stage Afp::GFPTg/+ embryo visualized for E-cadherin. Junctions exhibiting reduced E-cadherin (white arrowheads). Scale bars = 50 µm.
Figure 6. Cells originating in the visceral endoderm contribute to the embryonic gut
(A) Wholemount view of a 14 somite stage (E8.75) Afp::GFPTg/+ embryo. (B–D) Transverse sections at different rostrocaudal levels (dashed lines) though the embryo in A. (E) Wholemount view of a 15 somite stage (E8.75) Ttr::CreTg/+ ; R26::LNL::LacZ+/− embryo. (F–H) Transverse sections at different rostrocaudal levels (indicated by dashed lines) though the embryo in E. Individual visceral endoderm-derived cells with columnar epithelial morphology constitute part of the hindgut (blue arrowheads); lateral extremities of the gut tube devoid of visceral endoderm-derived cells (red arrowheads). Scale bars = 200 µm in A and E; 100 µm in B–D and F–H. (I) Diagram illustrating the subdivision of gut tube into foregut (fg), midgut (mg), and hindgut (hg) in a 15 somite stage (E8.75) embryo. (J) Histograms of visceral endoderm cell contribution to the gut in 14–18 somite stage (E8.75) Afp::GFPTg/+ and Ttr::CreTg/+ ; Z/EGTg/+ embryos. N = 8, 7, 7, 9, 11, and 7 in sequential left-to-right order of bars.
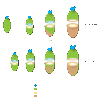
Figure 7. Models for endoderm morphogenesis in the mouse gastrula
Definitive endoderm arising at the anterior primitive streak located at the distal tip of the embryo in the vicinity of the node (previous model). As the definitive endoderm emerges, the visceral endoderm is displaced proximally towards the extraembryonic region. Visceral endoderm overlying the epiblast becomes dispersed by widespread intercalation of epiblast-derived cells (new model).
Comment in
- Aptly named visceral endoderm.
Stern CD. Stern CD. Dev Cell. 2008 Oct;15(4):493-4. doi: 10.1016/j.devcel.2008.09.015. Dev Cell. 2008. PMID: 18854133
Similar articles
- Aptly named visceral endoderm.
Stern CD. Stern CD. Dev Cell. 2008 Oct;15(4):493-4. doi: 10.1016/j.devcel.2008.09.015. Dev Cell. 2008. PMID: 18854133 - Regionalization of cell fates and cell movement in the endoderm of the mouse gastrula and the impact of loss of Lhx1(Lim1) function.
Tam PP, Khoo PL, Wong N, Tsang TE, Behringer RR. Tam PP, et al. Dev Biol. 2004 Oct 1;274(1):171-87. doi: 10.1016/j.ydbio.2004.07.005. Dev Biol. 2004. PMID: 15355796 - Definitive endoderm of the mouse embryo: formation, cell fates, and morphogenetic function.
Lewis SL, Tam PP. Lewis SL, et al. Dev Dyn. 2006 Sep;235(9):2315-29. doi: 10.1002/dvdy.20846. Dev Dyn. 2006. PMID: 16752393 Review. - Generation of Canine Induced Extraembryonic Endoderm-Like Cell Line That Forms Both Extraembryonic and Embryonic Endoderm Derivatives.
Nishimura T, Unezaki N, Kanegi R, Wijesekera DPH, Hatoya S, Sugiura K, Kawate N, Tamada H, Imai H, Inaba T. Nishimura T, et al. Stem Cells Dev. 2017 Aug 1;26(15):1111-1120. doi: 10.1089/scd.2017.0026. Epub 2017 Apr 25. Stem Cells Dev. 2017. PMID: 28474540 - Guts and gastrulation: Emergence and convergence of endoderm in the mouse embryo.
Nowotschin S, Hadjantonakis AK. Nowotschin S, et al. Curr Top Dev Biol. 2020;136:429-454. doi: 10.1016/bs.ctdb.2019.11.012. Epub 2019 Dec 18. Curr Top Dev Biol. 2020. PMID: 31959298 Review.
Cited by
- Temporal recording of mammalian development and precancer.
Islam M, Yang Y, Simmons AJ, Shah VM, Musale KP, Xu Y, Tasneem N, Chen Z, Trinh LT, Molina P, Ramirez-Solano MA, Sadien ID, Dou J, Rolong A, Chen K, Magnuson MA, Rathmell JC, Macara IG, Winton DJ, Liu Q, Zafar H, Kalhor R, Church GM, Shrubsole MJ, Coffey RJ, Lau KS. Islam M, et al. Nature. 2024 Oct;634(8036):1187-1195. doi: 10.1038/s41586-024-07954-4. Epub 2024 Oct 30. Nature. 2024. PMID: 39478207 Free PMC article. - StaVia: spatially and temporally aware cartography with higher-order random walks for cell atlases.
Stassen SV, Kobashi M, Lam EY, Huang Y, Ho JWK, Tsia KK. Stassen SV, et al. Genome Biol. 2024 Aug 16;25(1):224. doi: 10.1186/s13059-024-03347-y. Genome Biol. 2024. PMID: 39152459 Free PMC article. - The molecular and cellular choreography of early mammalian lung development.
Yang X, Chen Y, Yang Y, Li S, Mi P, Jing N. Yang X, et al. Med Rev (2021). 2024 Mar 26;4(3):192-206. doi: 10.1515/mr-2023-0064. eCollection 2024 Jun. Med Rev (2021). 2024. PMID: 38919401 Free PMC article. Review. - Toward developing human organs via embryo models and chimeras.
Wu J, Fu J. Wu J, et al. Cell. 2024 Jun 20;187(13):3194-3219. doi: 10.1016/j.cell.2024.05.027. Cell. 2024. PMID: 38906095 - A single-cell atlas of pig gastrulation as a resource for comparative embryology.
Simpson L, Strange A, Klisch D, Kraunsoe S, Azami T, Goszczynski D, Le Minh T, Planells B, Holmes N, Sang F, Henson S, Loose M, Nichols J, Alberio R. Simpson L, et al. Nat Commun. 2024 Jun 18;15(1):5210. doi: 10.1038/s41467-024-49407-6. Nat Commun. 2024. PMID: 38890321 Free PMC article.
References
- Andrews GK, Dziadek M, Tamaoki T. Expression and methylation of the mouse alpha-fetoprotein gene in embryonic, adult, and neoplastic tissues. J Biol Chem. 1982;257:5148–5153. - PubMed
- Ang SL, Rossant J. HNF-3 beta is essential for node and notochord formation in mouse development. Cell. 1994;78:561–574. - PubMed
- Azar Y, Eyal-Giladi H. The retention of primary hypoblastic cells underneath the developing primitive streak allows for their prolonged inductive influence. J Embryol Exp Morphol. 1983;77:143–151. - PubMed
Publication types
MeSH terms
Substances
Grants and funding
- R01-HD052115/HD/NICHD NIH HHS/United States
- R01 HD052115/HD/NICHD NIH HHS/United States
- R01 HD052115-02/HD/NICHD NIH HHS/United States
- P30 CA008748/CA/NCI NIH HHS/United States
- R01 HD052115-03/HD/NICHD NIH HHS/United States
- R01 HD052115-01A1/HD/NICHD NIH HHS/United States
LinkOut - more resources
Full Text Sources
Other Literature Sources
Molecular Biology Databases


