Expression and regulation of epithelial Na+ channels by nucleotides in pleural mesothelial cells - PubMed (original) (raw)
Expression and regulation of epithelial Na+ channels by nucleotides in pleural mesothelial cells
Hong-Guang Nie et al. Am J Respir Cell Mol Biol. 2009 May.
Abstract
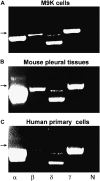
Pleural effusions are commonly clinical disorders, resulting from the imbalance between pleural fluid turnover and reabsorption. The mechanisms underlying pleural fluid clearance across the mesothelium remain to be elucidated. We hypothesized that epithelial Na(+) channel (ENaC) is expressed and forms the molecular basis of the amiloride-sensitive resistance in human mesothelial cells. Our RT-PCR results showed that three ENaC subunits, namely, alpha, beta, gamma, and two delta ENaC subunits, are expressed in human primary pleural mesothelial cells, a human mesothelioma cell line (M9K), and mouse pleural tissue. In addition, Western blotting and immunofluorescence microscopy studies revealed that alpha, beta, gamma, and delta ENaC subunits are expressed in primary human mesothelial cells and M9K cells at the protein level. An amiloride-inhibitable short-circuit current was detected in M9K monolayers and mouse pleural tissues when mounted in Ussing chambers. Whole-cell patch clamp recordings showed an ENaC-like channel with an amiloride concentration producing 50% inhibition of 12 microM in M9K cells. This cation channel has a high affinity for extracellular Na+ ions (K(m): 53 mM). The ion selectivity of this channel to cations follows the same order as ENaC: Li+ > Na+ > K+. The unitary Li(+) conductance was 15 pS in on-cell patches. Four ENaC subunits form a functional Na+ channel when coinjected into Xenopus oocytes. Furthermore, we found that both forskolin and cGMP increased the short-circuit currents in mouse pleural tissues. Taken together, our data demonstrate that the ENaC channels are biochemically and functionally expressed in human pleural mesothelial cells, and can be up-regulated by cyclic AMP and cyclic GMP.
Figures
**Figure 1.
RT-PCR analysis of α, β, γ, and δ epithelial Na channel (ENaC) mRNA expression in human pleural mesothelial cells and mouse pleural tissues. The expression pattern of ENaC subunits was confirmed with three independent experiments using the OneStep RT-PCR kit. The lanes from left to right represent α, β, δ, and γ ENaC subunits (α, β, δ, γ) and negative control (N). Arrows indicate a 500-bp marker. (A) M9K cells. (B) Mouse parietal pleural tissue. (C) Primary human mesothelial cells from healthy donor.
**Figure 2.
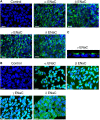
Immunofluorescent detection of ENaC proteins in human primary mesothelial cells. These images are representative of 10 similar fields from 3 independent experiments. Primary human mesothelial cells grown on coverslips were incubated with specific antibodies against α, β, γ, and δ ENaC subunits. ENaC antibodies were detected (green channel) with Alexa Fluor 488 goat anti-rabbit IgG (heavy + light). Nonimmune IgG was used to as negative control (top left–most panel). Cell nuclei were stained with 4′,6-diamidino-2-phenylindole (blue channel). Scale bars = 20 μm.
**Figure 3.
Immunofluorescent detection of ENaC proteins in confluent and unconfluent M9K malignant mesothelioma cells grown on permeable Transwell filter supports and coverslips. (A) Confluent M9K cells grown on permeable Transwell filters. Please see M
aterials and
M
ethods
and the legend for Figure 2 for details. (B) M9K cells grown on coverslips. These images represent 10 similar results of 3 independent experiments. Scale bars = 20 μm. (C) Side view of confluent M9K monolayer using confocal microscopy.
**Figure 4.
Western blot of ENaC proteins in M9K Cells. Proteins were extracted from M9K cells. H441 cells were used as a positive control. Blots were incubated with specific antibodies against α, γ, and δ ENaC subunits (left panels). To demonstrate specificity, the blots were incubated with the ENaC antibodies in the presence of an excess of the corresponding immunizing peptides (right panels). These experiments were repeated three times with identical results.
**Figure 5.
Amiloride blockade of short-circuit currents (Iscs) in basolaterally permeabilized M9K monolayers and normal mouse pleural tissue. Transepithelial Iscs were recorded with an Ussing chamber setup. (A) Typical current trace of Isc. In this case, the apical compartment contained 145 mM Na+, whereas the basolateral compartment contained 120 mM _N_-methyl-D-glucamine and 25 mM Na+. Once a stable baseline was reached, 100 μM amphotericin B was added to the basolateral compartment, which resulted in increased Isc. Amiloride (1–1,000 μM) was then added to the apical compartment (arrow). (B) Dose–response curve of amiloride blockade in M9K cells. Normalized amiloride-sensitive (AS) currents were calculated as follows: _I_normalized = 1 − (_I_0 − _I_×)/(_I_0 − _I_1,000), where _I_0 is control value, _I_× is steady-state current with concentration x, and _I_1,000 is current measured with 1 mM amiloride. Values are means (± SE); numbers in brackets are samples recorded. The concentration producing 50% inhibition (IC50) was calculated by best fit of data points to the following equation: _I_normalized = 1 + (x/IC50)coefficient. (C) Representative Isc trace showing inhibition by different concentrations of amiloride in mouse pleural tissue. (D) The IC50 calculation method is the same as that described in (B).
**Figure 6.
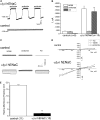
Whole-cell AS Na+ currents in αβγδ human ENaC (hENaC)–expressing oocytes. AS currents were computed as the difference between the currents with and without 10 μM amiloride in the bath. (A) Representative whole-cell current recordings at −100 mV from an oocyte expressing αβγδ hENaC (αβγδ hENaC, top panel) and an uninjected oocyte (control, bottom panel). Oocytes were initially perfused with ND-96 medium. The bath solution was then switched to ND-96 medium plus 10 μM amiloride. This application of amiloride was repeated two additional times to the same oocyte, as indicted by solid bars. The dashed lines indicated zero current level. (B) Analysis of Na+ currents (I) in uninjected (control) and αβγδ hENaC–expressing oocytes (αβγδ hENaC). ND-96, amiloride, and AS represent Na+ currents recorded in ND-96 medium, ND-96 medium plus 10 μM amiloride, and subtraction of these two (AS currents), respectively. This result is consistent with (A) (bottom), showing that there are no AS Na+ currents in uninjected oocytes. The number in brackets stands for the total oocytes for each group. **P < 0.01, compared between AS of αβγδ hENaC and those of control. (C) Representative whole-cell Na+ current traces before (ND-96, left) and after application of 10 μM amiloride (amiloride, middle) and their subtraction (AS, right) from an uninjected oocyte (control, top) and an oocyte expressing αβγδ hENaC (αβγδ hENaC, bottom). Oocytes were held at −40 mV, and then stepped from −120 mV to +80 mV in 20-mV increments. (D) Current–voltage relationships. Whole-cell Na+ currents (I) at membrane potential (Vm) from −120 mV to +80 mV were recorded from an uninjected oocyte (control, top) and oocytes expressing αβγδ hENaC (αβγδ hENaC, bottom). Average current levels of total (ND-96, triangle), amiloride-resistant (Amiloride, circle), and AS Na+ currents (AS, square) were plotted as a function of Vm. (E) Resting Vms in oocytes expressing αβγδ hENaC (αβγδ hENaC) and uninjected cells (control). The number in brackets stands for the total oocytes for each group. **P < 0.01.
**Figure 7.
Patch clamp recordings of whole-cell currents and inhibition by amiloride in M9K cells. (A) Representative recordings of whole-cell currents and inhibition by different concentrations of amiloride (1 μM to 1 mM) in M9K cells. (B) Concentration-dependent inhibition of whole-cell currents by amiloride. For each cell, inward currents recorded at −40 mV were measured during perfusion with external solutions. IC50 was calculated by best fitting the raw data points to the Hill equation.
**Figure 8.
Na+ affinity of native cation channels in M9K cells. (A) Typical traces recorded in the presence of varying concentrations of extracellular Na+ ions. (B) Dependence of AS currents on bath Na+ concentration ([Na+]out). Normalized currents were computed by dividing currents at D100 mV at the indicated [Na+]out by the corresponding value at 140 mM Na+; n = 4. Solid line: the raw data were fitted with the Michaelis-Menten equation (Km: 52.85 ± 11.47 mM).
**Figure 9.
Cation selectivity of AS Na+ channels in M9K cells. AS currents were computed by subtracting the whole-cell current obtained in the presence of 10 μM amiloride from the total current in the absence of drug. Measurements were conducted with external solutions predominately containing Na+, Li+, and K+ ions as charge carriers. (A) Typical step current traces recorded when perfused with Na+, Li+, and K+ ions. The dashed lines indicate zero current level. (B) Current–voltage relationships. Whole-cell AS current densities (AS density, pA/pF) at membrane potential (Vm, mV) from −120 mV to +60 mV were recorded from M9K cells. Average current levels in external solution containing Na+ (squares), Li+ (circles), or K+ (triangles) ions were plotted as a function of Vm. Values are means (± SE). The number in brackets represents the total M9K cells for each group.
**Figure 10.
Single-channel recordings of Li+-permeable channels in M9K cells. Cell-attached configuration was applied to record unitary currents at membrane potentials (Vms) of −40 mV to −120 mV (from top to bottom). (A) Representative single-channel current traces. Closed level is indicated with dotted lines. One open level is shown. These experiments were repeated with M9K cells grown on glass coverslips for five passages. (B) Single-channel current–voltage relationship. Unitary current amplitudes were measured by CLAMPFIT from raw current traces. Average currents were plotted against Vms. The Li+ conductance was computed as the slope of the fitted linear line; n = 6.
**Figure 11.
Regulation of transmesothelial Iscs by cAMP and cGMP in mouse pleural tissues. Freshly excised pleural tissues from BALB/c male mice were mounted in horizontal Ussing chambers, as described in M
aterials and
M
ethods
. Forskolin (20 μM), pCPT-cGMP salt (cGMP, 0.2 mM), and amiloride (1 mM) were added as indicated by arrows. (A_–_C) Representative Isc trace in the presence of forskolin (FSK), cGMP, and cGMP plus protein kinase (PK) A inhibitor. (D) Normalized Isc recorded in the absence (basal) and presence of forskolin (FSK), cGMP, and cGMP plus PKA inhibitor. Paired t test was used to analyze the statistical current differences between each drug by comparing the normalized current values before and after application to the bath. *P < 0.05; numbers are samples recorded.
Similar articles
- Delta-subunit confers novel biophysical features to alpha beta gamma-human epithelial sodium channel (ENaC) via a physical interaction.
Ji HL, Su XF, Kedar S, Li J, Barbry P, Smith PR, Matalon S, Benos DJ. Ji HL, et al. J Biol Chem. 2006 Mar 24;281(12):8233-41. doi: 10.1074/jbc.M512293200. Epub 2006 Jan 19. J Biol Chem. 2006. PMID: 16423824 - Characterization of a novel splice variant of δ ENaC subunit in human lungs.
Zhao RZ, Nie HG, Su XF, Han DY, Lee A, Huang Y, Chang Y, Matalon S, Ji HL. Zhao RZ, et al. Am J Physiol Lung Cell Mol Physiol. 2012 Jun 15;302(12):L1262-72. doi: 10.1152/ajplung.00331.2011. Epub 2012 Apr 13. Am J Physiol Lung Cell Mol Physiol. 2012. PMID: 22505667 Free PMC article. - AICAR decreases the activity of two distinct amiloride-sensitive Na+-permeable channels in H441 human lung epithelial cell monolayers.
Albert AP, Woollhead AM, Mace OJ, Baines DL. Albert AP, et al. Am J Physiol Lung Cell Mol Physiol. 2008 Nov;295(5):L837-48. doi: 10.1152/ajplung.90353.2008. Epub 2008 Aug 22. Am J Physiol Lung Cell Mol Physiol. 2008. PMID: 18723760 Free PMC article. - Is the Amiloride-Sensitive Na+ Channel in Taste Cells Really ENaC?
Vandenbeuch A, Kinnamon SC. Vandenbeuch A, et al. Chem Senses. 2020 May 21;45(4):233-234. doi: 10.1093/chemse/bjaa011. Chem Senses. 2020. PMID: 32099995 Free PMC article. Review. - CPT-cGMP Is A New Ligand of Epithelial Sodium Channels.
Ji HL, Nie HG, Chang Y, Lian Q, Liu SL. Ji HL, et al. Int J Biol Sci. 2016 Jan 28;12(4):359-66. doi: 10.7150/ijbs.13764. eCollection 2016. Int J Biol Sci. 2016. PMID: 27019621 Free PMC article. Review.
Cited by
- Permeability of the arachnoid and pia mater. The role of ion channels in the leptomeningeal physiology.
Filippidis AS, Zarogiannis SG, Ioannou M, Gourgoulianis K, Molyvdas PA, Hatzoglou C. Filippidis AS, et al. Childs Nerv Syst. 2012 Apr;28(4):533-40. doi: 10.1007/s00381-012-1688-x. Epub 2012 Jan 18. Childs Nerv Syst. 2012. PMID: 22252717 - Transepithelial Fluid and Salt Re-Absorption Regulated by cGK2 Signals.
Chang J, Ding Y, Zhou Z, Nie HG, Ji HL. Chang J, et al. Int J Mol Sci. 2018 Mar 16;19(3):881. doi: 10.3390/ijms19030881. Int J Mol Sci. 2018. PMID: 29547542 Free PMC article. Review. - δ ENaC: a novel divergent amiloride-inhibitable sodium channel.
Ji HL, Zhao RZ, Chen ZX, Shetty S, Idell S, Matalon S. Ji HL, et al. Am J Physiol Lung Cell Mol Physiol. 2012 Dec 15;303(12):L1013-26. doi: 10.1152/ajplung.00206.2012. Epub 2012 Sep 14. Am J Physiol Lung Cell Mol Physiol. 2012. PMID: 22983350 Free PMC article. Review. - The delta-subunit of the epithelial sodium channel (ENaC) enhances channel activity and alters proteolytic ENaC activation.
Haerteis S, Krueger B, Korbmacher C, Rauh R. Haerteis S, et al. J Biol Chem. 2009 Oct 16;284(42):29024-40. doi: 10.1074/jbc.M109.018945. Epub 2009 Aug 28. J Biol Chem. 2009. PMID: 19717556 Free PMC article. - Dexamethasone acutely accelerates pleural fluid absorption in mice hydrothoraces.
Zarogiannis S, Psallidas I, Hatzoglou C, Gourgoulianis KI, Kalomenidis I. Zarogiannis S, et al. J Physiol Sci. 2010 Jul;60(4):299-302. doi: 10.1007/s12576-010-0089-8. Epub 2010 Apr 10. J Physiol Sci. 2010. PMID: 20383620 Free PMC article.
References
- Lai-Fook SJ. Pleural mechanics and fluid exchange. Physiol Rev 2004;84:385–410. - PubMed
- Yung S, Li FK, Chan TM. Peritoneal mesothelial cell culture and biology. Perit Dial Int 2006;26:162–173. - PubMed
- Zocchi L. Physiology and pathophysiology of pleural fluid turnover. Eur Respir J 2002;20:1545–1558. - PubMed
- Mutsaers SE. The mesothelial cell. Int J Biochem Cell Biol 2004;36:9–16. - PubMed
Publication types
MeSH terms
Substances
LinkOut - more resources
Full Text Sources
Medical


