The spinocerebellar ataxia 12 gene product and protein phosphatase 2A regulatory subunit Bbeta2 antagonizes neuronal survival by promoting mitochondrial fission - PubMed (original) (raw)
The spinocerebellar ataxia 12 gene product and protein phosphatase 2A regulatory subunit Bbeta2 antagonizes neuronal survival by promoting mitochondrial fission
Ruben K Dagda et al. J Biol Chem. 2008.
Abstract
The neurodegenerative disorder spinocerebellar ataxia 12 (SCA12) is caused by CAG repeat expansion in the non-coding region of the PPP2R2B gene. PPP2R2B encodes Bbeta1 and Bbeta2, alternatively spliced and neuron-specific regulatory subunits of the protein phosphatase 2A (PP2A) holoenzyme. We show here that in PC12 cells and hippocampal neurons, cell stressors induced a rapid translocation of PP2A/Bbeta2 to mitochondria to promote apoptosis. Conversely, silencing of PP2A/Bbeta2 protected hippocampal neurons against free radical-mediated, excitotoxic, and ischemic insults. Evidence is accumulating that the mitochondrial fission/fusion equilibrium is an important determinant of cell survival. Accordingly, we found that Bbeta2 expression induces mitochondrial fragmentation, whereas Bbeta2 silencing or inhibition resulted in mitochondrial elongation. Based on epistasis experiments involving Bcl2 and core components of the mitochondrial fission machinery (Fis1 and dynamin-related protein 1), mitochondrial fragmentation occurs upstream of apoptosis and is both necessary and sufficient for hippocampal neuron death. Our data provide the first example of a proapoptotic phosphatase that predisposes to neuronal death by promoting mitochondrial division and point to a possible imbalance of the mitochondrial morphogenetic equilibrium in the pathogenesis of SCA12.
Figures
FIGURE 1.
The PP2A regulatory subunit Bβ2 translocates to mitochondria to promote neuronal death. A–C, PC12 cells transfected with Bβ2-GFP (∼50% efficiency) were treated for up to 48 h with vehicle (control), tunicamycin (1.4 μ
m
), or rotenone (10 μ
m
), stained with MitoTracker and the DNA dye DRAQ5, and analyzed live by confocal microscopy for colocalization of Bβ2(GFP) and mitochondria (mito) and for apoptotic nuclei (representative images shown in A, quantification shown in_B_ and C) (means ± S.E. of 3 experiments with 40–60 transfected cells per condition, *, p < 0.01 by Student's t test). D and E, primary hippocampal neurons infected with lentivirus (feline immunodeficiency virus) expressing Bβ1-GFP or Bβ2-GFP (80–100% efficiency) were treated with vehicle or 2 μ
m
rotenone followed by live confocal imaging of GFP and mitochondria (mito, stained with TMRM). Shown are representative images at 24 h ± rotenone (D) and a time course of rotenone-induced mitochondrial translocation of Bβ2-GFP and apoptosis in hippocampal neurons (E) (means ± S.E. of n = 3 independent experiments). Mitochondrial localization of Bβ2 was blindly scored on a reference image-based scale (0–4) and converted to a percent value to facilitate comparison with apoptosis (the percentage of infected neurons with DRAQ5-stained apoptotic nuclei).
FIGURE 2.
Endogenous PP2A/Bβ2 translocates to mitochondria in stressed hippocampal neurons. Primary hippocampal cultures were treated with glutamate (Glu, 200 μ
m
for 15 min), rotenone (Rot, 2.5 μ
m
for 2 h), staurosporine (STS, 0.5 μ
m
for 2 h), or vehicle only (basal), fixed after 2 h, and processed for immunofluorescence with Bβ2 antibodies. For epifluorescence microscopy (A and C), mitochondria (mito) were visualized with antibodies against cytochrome c, whereas cultures used for confocal microscopy (B and D) were virally transduced with mitochondria-targeted GFP. A, representative epifluorescence images of control and glutamate-treated neurons, with the_inset_ showing colocalization of Bβ2 and cytochrome c in dendritic varicosities. B, representative confocal sections through the soma of vehicle versus rotenone-treated hippocampal neurons labeled for Bβ2 and mitochondrial GFP. C, quantification of Bβ2 clustering in dendrites by image analysis using the ImageJ software. Dendritic clusters were outlined by automatic segmentation of images captured with constant camera settings, and their fluorescence intensities (8-bit pixel value) were averaged for each neuron. D, colocalization of somatic Bβ2 and mitochondria quantified by blinded comparison with a set of reference images. Bar graphs show means ± S.E. of 50–100 (C) or 19 and 23 neurons (D) from experiments representative of three, *, p < 10–5.
FIGURE 3.
Mitochondrial targeting of PP2A/Bβ2 is neurotoxic, whereas silencing is neuroprotective. A, hippocampal neurons were transfected with the indicated GFP fusion proteins (om, outer mitochondrial; WT, wild-type) and scored for Hoechst 33342-stained apoptotic nuclei 5–6 days later (means ± S.E. of n = 3–7 experiments with 85–90 neurons each). Bβ2 mutants that block mitochondrial localization (R6A) or PP2A dimer recruitment (RR168EE) also block apoptosis induction. Wild-type and mutant Bβ2 were expressed at similar levels as judged by GFP fluorescence and immunoblotting (data not shown). B–D, hippocampal cultures were cotransfected with Bβ2-directed (B_β_2(#1)) or nonsense (NS) shRNAs and expression marker plasmids, challenged after 3–5 days with glutamate (250 μ
m
for 20 min), oxygen-glucose deprivation (25 min), or rotenone (400 n
m
continuously), and analyzed 2–3 days later for survival. Glutamate and rotenone-treated cultures were processed for β-galactosidase (β_Gal_) or GFP expression marker and neurofilament (NF) protein immunofluorescence, and the number of transfected, surviving neurons was expressed relative to unchallenged cultures. Representative fields in_B_ show glutamate-dependent degeneration (loss of neurofilament staining, gray) of untransfected, but not Bβ2 shRNA transfected (β-galactosidase-positive, white) neurons. Survival in oxygen-glucose-deprived cultures (D) was assessed by cotransfection with luciferase under control of the neuron-specific calcitonin gene-related peptide promoter and luciferase assays. E, hippocampal neurons transfected with vectors expressing the indicated shRNAs and GFP were treated ± 400 n
m
rotenone for 48 h, fixed, and stained to visualize apoptotic nuclei (means ± S.E. of 3–7 (C), 4 (D), and 3–4 (E) experiments; Student's t test comparisons between nonsense and Bβ2 shRNA transfections within each challenge group).
FIGURE 4.
PP2A/Bβ2 induces mitochondrial fragmentation. The indicated cDNAs (GFP fusion proteins) and shRNAs (with GFP expression marker) were either transduced via lentivirus or transfected into hippocampal neurons. After 2–3 days, morphology of TMRM-stained mitochondria (mito) was assessed by blinded comparison with a set of reference images (0–4).A, representative live confocal images. B, summary (means ± S.E. of n = 3–7 experiments with 25–30 neurons each; om, outer mitochondrial; WT, wild-type; Student's_t_ test comparisons between GFP fusion proteins and omGFP and between nonsense (NS) and Bβ2 shRNAs).
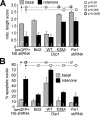
FIGURE 5.
Mitochondrial fission is necessary and sufficient for neuronal apoptosis. Hippocampal neurons were transfected with the indicated plasmids (and a GFP marker if applicable), treated after 3–5 days with vehicle (basal) or 400 n
m
rotenone, and analyzed after an additional 2 days. Mitochondrial morphology (A) was determined after live staining with TMRM, whereas apoptosis (B) was scored in fixed and Hoechst 33342-stained cultures as the percentage of transfected neurons with condensed/fragmented nuclei (means ± S.E. of 3–7 experiments). Driving mitochondrial fragmentation by wild-type Drp1 expression promotes, whereas inhibiting fragmentation (dominant-negative Drp1 K38A, Fis1 shRNA) stalls apoptosis. om, outer mitochondrial; WT, wild-type; NS, nonsense.
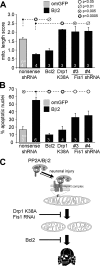
FIGURE 6.
Mitochondrial restructuring underlies survival regulation by outer mitochondrial PP2A/Bβ2. Hippocampal neurons were transfected with the indicated plasmid combinations and scored after 2–3 days for mitochondrial morphology (A, live TMRM stain) or after 5–6 days for apoptosis (B, the percentage of transfected neurons with condensed/fragmented nuclei). Means ± S.E. of n = 3–6 experiments are shown. om, outer mitochondrial. C, model illustrating the findings in this study (see “Discussion” for details).
Similar articles
- N-terminal phosphorylation of protein phosphatase 2A/Bβ2 regulates translocation to mitochondria, dynamin-related protein 1 dephosphorylation, and neuronal survival.
Merrill RA, Slupe AM, Strack S. Merrill RA, et al. FEBS J. 2013 Jan;280(2):662-73. doi: 10.1111/j.1742-4658.2012.08631.x. Epub 2012 Jun 8. FEBS J. 2013. PMID: 22583914 Free PMC article. - Deletion of a Neuronal Drp1 Activator Protects against Cerebral Ischemia.
Flippo KH, Lin Z, Dickey AS, Zhou X, Dhanesha NA, Walters GC, Liu Y, Merrill RA, Meller R, Simon RP, Chauhan AK, Usachev YM, Strack S. Flippo KH, et al. J Neurosci. 2020 Apr 8;40(15):3119-3129. doi: 10.1523/JNEUROSCI.1926-19.2020. Epub 2020 Mar 6. J Neurosci. 2020. PMID: 32144179 Free PMC article. - De novo missense variants in the PP2A regulatory subunit PPP2R2B in a neurodevelopmental syndrome: potential links to mitochondrial dynamics and spinocerebellar ataxias.
Sandal P, Jong CJ, Merrill RA, Kollman GJ, Paden AH, Bend EG, Sullivan J, Spillmann RC, Shashi V, Vulto-van Silfhout AT, Pfundt R, de Vries BBA, Li PP, Bicknell LS, Strack S. Sandal P, et al. Hum Mol Genet. 2025 Jan 29;34(2):193-203. doi: 10.1093/hmg/ddae166. Hum Mol Genet. 2025. PMID: 39565297 Free PMC article. - Spinocerebellar ataxia type 12.
O'Hearn E, Holmes SE, Margolis RL. O'Hearn E, et al. Handb Clin Neurol. 2012;103:535-47. doi: 10.1016/B978-0-444-51892-7.00034-6. Handb Clin Neurol. 2012. PMID: 21827912 Review. - SCA12: an unusual mutation leads to an unusual spinocerebellar ataxia.
Holmes SE, Hearn EO, Ross CA, Margolis RL. Holmes SE, et al. Brain Res Bull. 2001 Oct-Nov 1;56(3-4):397-403. doi: 10.1016/s0361-9230(01)00596-2. Brain Res Bull. 2001. PMID: 11719278 Review.
Cited by
- From pathways to targets: understanding the mechanisms behind polyglutamine disease.
Weber JJ, Sowa AS, Binder T, Hübener J. Weber JJ, et al. Biomed Res Int. 2014;2014:701758. doi: 10.1155/2014/701758. Epub 2014 Sep 21. Biomed Res Int. 2014. PMID: 25309920 Free PMC article. Review. - Synaptic dysfunction, memory deficits and hippocampal atrophy due to ablation of mitochondrial fission in adult forebrain neurons.
Oettinghaus B, Schulz JM, Restelli LM, Licci M, Savoia C, Schmidt A, Schmitt K, Grimm A, Morè L, Hench J, Tolnay M, Eckert A, D'Adamo P, Franken P, Ishihara N, Mihara K, Bischofberger J, Scorrano L, Frank S. Oettinghaus B, et al. Cell Death Differ. 2016 Jan;23(1):18-28. doi: 10.1038/cdd.2015.39. Epub 2015 Apr 24. Cell Death Differ. 2016. PMID: 25909888 Free PMC article. - Mitochondrial dynamics in neuronal injury, development and plasticity.
Flippo KH, Strack S. Flippo KH, et al. J Cell Sci. 2017 Feb 15;130(4):671-681. doi: 10.1242/jcs.171017. Epub 2017 Feb 2. J Cell Sci. 2017. PMID: 28154157 Free PMC article. Review. - PKA/AKAP1 and PP2A/Bβ2 regulate neuronal morphogenesis via Drp1 phosphorylation and mitochondrial bioenergetics.
Dickey AS, Strack S. Dickey AS, et al. J Neurosci. 2011 Nov 2;31(44):15716-26. doi: 10.1523/JNEUROSCI.3159-11.2011. J Neurosci. 2011. PMID: 22049414 Free PMC article. - Genomic landscape of positive natural selection in Northern European populations.
Lappalainen T, Salmela E, Andersen PM, Dahlman-Wright K, Sistonen P, Savontaus ML, Schreiber S, Lahermo P, Kere J. Lappalainen T, et al. Eur J Hum Genet. 2010 Apr;18(4):471-8. doi: 10.1038/ejhg.2009.184. Epub 2009 Oct 21. Eur J Hum Genet. 2010. PMID: 19844263 Free PMC article.
References
- Dimmer, K. S., and Scorrano, L. (2006) Physiol. (Bethesda) 21 233–241 - PubMed
- Chan, D. C. (2006) Cell 125 1241–1252 - PubMed
- McBride, H. M., Neuspiel, M., and Wasiak, S. (2006) Curr. Biol. 16 R551–560 - PubMed
- Verstreken, P., Ly, C. V., Venken, K. J., Koh, T. W., Zhou, Y., and Bellen, H. J. (2005) Neuron 47 365–378 - PubMed
- Li, Z., Okamoto, K., Hayashi, Y., and Sheng, M. (2004) Cell 119 873–887 - PubMed
Publication types
MeSH terms
Substances
Grants and funding
- R01 NS046450/NS/NINDS NIH HHS/United States
- NS054614/NS/NINDS NIH HHS/United States
- R01 NS035563/NS/NINDS NIH HHS/United States
- NS056244/NS/NINDS NIH HHS/United States
- NS046450/NS/NINDS NIH HHS/United States
- F31 NS049659/NS/NINDS NIH HHS/United States
- NS043254/NS/NINDS NIH HHS/United States
LinkOut - more resources
Full Text Sources
Molecular Biology Databases
Research Materials
Miscellaneous


