Ly49h-deficient C57BL/6 mice: a new mouse cytomegalovirus-susceptible model remains resistant to unrelated pathogens controlled by the NK gene complex - PubMed (original) (raw)
Ly49h-deficient C57BL/6 mice: a new mouse cytomegalovirus-susceptible model remains resistant to unrelated pathogens controlled by the NK gene complex
Nassima Fodil-Cornu et al. J Immunol. 2008.
Abstract
Cmv1 was the first mouse cytomegalovirus (MCMV) resistance locus identified in C57BL/6 mice. It encodes Ly49H, a NK cell-activating receptor that specifically recognizes the m157 viral protein at the surface of MCMV-infected cells. To dissect the effect of the Ly49h gene in host-pathogen interactions, we generated C57BL/6 mice lacking the Ly49h region. We found that 36 h after MCMV infection, the lack of Ly49h resulted in high viral replication in the spleen and dramatically enhanced proinflammatory cytokine production in the serum and spleen. At later points in time, we observed that MCMV induced a drastic loss in CD8(+) T cells in B6.Ly49h(-/-) mice, probably reflecting severe histological changes in the spleen. Overall, our results indicate that Ly49H(+) NK cells contain a systemic production of cytokines that may contribute to the MCMV-induced pathology and play a central role in maintaining normal spleen cell microarchitecture. Finally, we tested the ability of B6.Ly49h(-/-) mice to control replication of Leishmania major and ectromelia virus. Resistance to these pathogens has been previously mapped within the NK gene complex. We found that the lack of Ly49H(+) NK cells is not associated with an altered resistance to L. major. In contrast, absence of Ly49H(+) NK cells seems to afford additional protection against ectromelia infection in C57BL/6 mice, suggesting that Ly49H may recognize ectromelia-infected cells with detrimental effects. Taken together, these results confirm the pivotal role of the Ly49H receptor during MCMV infection and open the way for further investigations in host-pathogen interactions.
Conflict of interest statement
Disclosures
The authors have no financial conflict of interest.
Figures
FIGURE 1
Fine mapping of the Ly49h deletion in BXD-8 mice. A, Physical map in the vicinity of Ly49h gene. B, Gene structure of Ly49h gene. Exons are indicated as black boxes and are numbered 1–8. Gray boxes correspond to repeated sequences. The position of genetic markers used is indicated below. Markers D6Ott68, 72, and 74 are deleted in BXD-8 mice. C, STS content analysis of C57BL/6 and BXD-8 DNA with marker across the Ly49h genomic domain indicated in B. D, Sequence of the deleted BXD8 allele at the breakpoint. The proximal and distal sides of the deletion overlap by 4 bp.
FIGURE 2
Generation, genotyping, and Ly49 receptors expression analysis of _Ly49h_- deficient mice. A, For the genotyping of C57BL/6 Ly49h+/+, _Ly49h_−/−, and Ly49h+/− mice, two rounds of PCR were used. The first PCR characterizes the 1020-bp product corresponding to the deletion of the ly49h region. Ly49h heterozygote and homozygote mice were distinguished by another round of PCR specific for the intron 1 of the Ly49h gene using the marker D6Ott151 (250–bp PCR product). B, Classes of offspring observed are as genetically expected. C and D, Ly49 genes around the Ly49h deletion are normally expressed. Single- cell suspensions of splenocytes (C) and IL-2-activated splenocytes (D) were prepared and stained with mAb specific for Ly49D, Ly49H (3D10), Ly49C/I, Ly49G, and Ly49A (percentage of positive cells). Cytotoxic activity of lymphokine-activated killer cells from indicated mice was performed against RMA, RMA-S, CHO, and YAC-1 at indicated the E:T ratios (E).The frequency of pDC is analyzed by FACS using the indicated Abs (F).
FIGURE 3
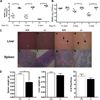
B6._Ly49h_−/− and B6. Ly49h+/+ mice exhibit different phenotypes upon MCMV infection. A and B, MCMV titers in the spleen and the liver of B6._Ly49h_−/− and B6.Ly49h+/+ mouse strains. Mice were infected with 5000 PFU of MCMV, and the organs were harvested at the indicated times. Viral titer was determined by plaque assays using BALB/c mouse embryonic fibroblast cells. C, Histology and evaluation of liver and spleen disease by H&E staining and microscopy analysis of a 5-µm tissue section. a, b, e, and f are livers and spleen sections from uninfected mice. c, d, g, and h are livers and spleens from infected mice. Inflammatory foci are indicated with an arrow. D, Examination of liver and spleen weights on day 3 p.i. The number of inflammatory foci in the liver was determined by counting clusters of cells in three randomly selected fields of 1.86 mm2 each, at a magnification of ×100. Necrotic areas were histologically identified as large, subcapsular, eosinophilic areas of necrotic hepatocytes.
FIGURE 4
Quantification of cytokines in the serum and spleen homogenates on day 1.5 after MCMV infection. Serum or spleen homogenates collected on day 1.5 after MCMV infection as described in Materials and Methods were assessed for cytokine levels. A, Quantification of IFN-α/β with a bioassay technique using L929 cells. B, Quantifiation of IL-12p70 with ELISA. C, Quantification of IFN-γ with ELISA. Black histograms represent infected mice at day 1.5 p.i. White histograms represent noninfected mice. Results are expressed as mean ± SEM of three mice per group. Asterisks indicate statistically significant differences between indicated genotypes (*, p < 0.05; **, p < 0.005; and ***, p < 0.001). ø, Not detected. One of two representative experiments is shown.
FIGURE 5
Loss of the Ly49h gene induces critical changes in the spleen cell component upon infection by MCMV. Splenocytes were harvested from B6.Ly49h+/+ mice and B6._Ly49h_−/− mice in uninfected mice (white histograms) or at day 3 post MCMV infection (black histograms) and analyzed for lymphoid populations as described in Material and Methods. (A) Represents the percentage of the indicated population. (B) Cell enumeration of the indicated population. Results are expressed as Mean ± SEM of three mice per group. Asterisks indicate statistically significant differences between indicated genotypes. (*p < 0.05; **p < 0.005; ***p < 0.001). +/+: B6.Ly49h+/+ mice; −/−: B6._Ly49h_−/− mice. One experiment representative of at least two is shown.
FIGURE 6
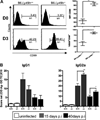
Th1 vs Th2 specific Ab response to MCMV in B6.Ly49h+/+ and B6._Ly49h_−/− mice. B cells from uninfected (D0) or day 3 (D3) MCMV Infected mice were analyzed with CD69 activating Ab. The MFI or the percentage of CD69 expressing B cells is indicated (A). MCMV specific IgG1 (left) and MCMV specific IgG2a (right) were assessed by ELISA in serum from uninfected mice (2 mice per group) or at 15 days and 40 days p.i. with 5000 PFU of MCMV(4–5 mice per group). The net absorbance value (OD MCMV-Ag-OD Tissue Control) ×10 was converted to score by dividing by 0.13 (B). Asterisks indicate statistically significant differences between indicated genotypes. (*p < 0.05; **p < 0.005).
FIGURE 7
Leismania major and ECTV infection of B6._Ly49h_−/− mice. (A) Mice were infected with 5 × 10⁶ Leishmania promastigotes in their hind footpads. The disease progression was monitored weekly by caliper measurement +/+ : B6.Ly49h+/+ mice; −/−: B6._Ly49h_−/− mice. (B) Mice were infected through the tail vein with 2000 PFU or their hind footpads with 500 and 50 PFU of ECTV. After 5 days of infection, mice were sacrificed and ECTV titer was assessed in the spleen (*p < 0.05; **p < 0.005).
Similar articles
- Cmv1-independent antiviral role of NK cells revealed in murine cytomegalovirus-infected New Zealand White mice.
Rodriguez M, Sabastian P, Clark P, Brown MG. Rodriguez M, et al. J Immunol. 2004 Nov 15;173(10):6312-8. doi: 10.4049/jimmunol.173.10.6312. J Immunol. 2004. PMID: 15528370 - Transgenic expression of the activating natural killer receptor Ly49H confers resistance to cytomegalovirus in genetically susceptible mice.
Lee SH, Zafer A, de Repentigny Y, Kothary R, Tremblay ML, Gros P, Duplay P, Webb JR, Vidal SM. Lee SH, et al. J Exp Med. 2003 Feb 17;197(4):515-26. doi: 10.1084/jem.20021713. J Exp Med. 2003. PMID: 12591908 Free PMC article. - Natural Killer Cell Sensing of Infected Cells Compensates for MyD88 Deficiency but Not IFN-I Activity in Resistance to Mouse Cytomegalovirus.
Cocita C, Guiton R, Bessou G, Chasson L, Boyron M, Crozat K, Dalod M. Cocita C, et al. PLoS Pathog. 2015 May 8;11(5):e1004897. doi: 10.1371/journal.ppat.1004897. eCollection 2015 May. PLoS Pathog. 2015. PMID: 25954804 Free PMC article. - Genetic control of innate immune responses against cytomegalovirus: MCMV meets its match.
Webb JR, Lee SH, Vidal SM. Webb JR, et al. Genes Immun. 2002 Aug;3(5):250-62. doi: 10.1038/sj.gene.6363876. Genes Immun. 2002. PMID: 12140743 Review. - Adaptive reconfiguration of the human NK-cell compartment in response to cytomegalovirus: a different perspective of the host-pathogen interaction.
Muntasell A, Vilches C, Angulo A, López-Botet M. Muntasell A, et al. Eur J Immunol. 2013 May;43(5):1133-41. doi: 10.1002/eji.201243117. Eur J Immunol. 2013. PMID: 23552990 Review.
Cited by
- IL-33 receptor ST2 amplifies the expansion of NK cells and enhances host defense during mouse cytomegalovirus infection.
Nabekura T, Girard JP, Lanier LL. Nabekura T, et al. J Immunol. 2015 Jun 15;194(12):5948-52. doi: 10.4049/jimmunol.1500424. Epub 2015 Apr 29. J Immunol. 2015. PMID: 25926677 Free PMC article. - Innate immunity regulates adaptive immune response: lessons learned from studying the interplay between NK and CD8+ T cells during MCMV infection.
Mitrović M, Arapović J, Traven L, Krmpotić A, Jonjić S. Mitrović M, et al. Med Microbiol Immunol. 2012 Nov;201(4):487-95. doi: 10.1007/s00430-012-0263-0. Epub 2012 Sep 11. Med Microbiol Immunol. 2012. PMID: 22965169 Free PMC article. Review. - Natural killer cells in experimental and human leishmaniasis.
Bogdan C. Bogdan C. Front Cell Infect Microbiol. 2012 May 29;2:69. doi: 10.3389/fcimb.2012.00069. eCollection 2012. Front Cell Infect Microbiol. 2012. PMID: 22919660 Free PMC article. Review. - Control of nutrient uptake by IRF4 orchestrates innate immune memory.
Santosa EK, Kim H, Rückert T, Le Luduec JB, Abbasi AJ, Wingert CK, Peters L, Frost JN, Hsu KC, Romagnani C, Sun JC. Santosa EK, et al. Nat Immunol. 2023 Oct;24(10):1685-1697. doi: 10.1038/s41590-023-01620-z. Epub 2023 Sep 11. Nat Immunol. 2023. PMID: 37697097 Free PMC article. - Distinct MHC class I-dependent NK cell-activating receptors control cytomegalovirus infection in different mouse strains.
Pyzik M, Charbonneau B, Gendron-Pontbriand EM, Babić M, Krmpotić A, Jonjić S, Vidal SM. Pyzik M, et al. J Exp Med. 2011 May 9;208(5):1105-17. doi: 10.1084/jem.20101831. Epub 2011 Apr 25. J Exp Med. 2011. PMID: 21518798 Free PMC article.
References
- Sinclair J, Sissons P. Latency and reactivation of human cytomegalovirus. J. Gen. Virol. 2006;87:1763–1779. - PubMed
- Mocarski ES., Jr Immunomodulation by cytomegaloviruses: manipulative strategies beyond evasion. Trends Microbiol. 2002;10:332–339. - PubMed
- Orange JS, Biron CA. An absolute and restricted requirement for IL-12 in natural killer cell IFN-γ production and antiviral defense: studies of natural killer and T cell responses in contrasting viral infections. J. Immunol. 1996;156:1138–1142. - PubMed
- Biron CA, Byron KS, Sullivan JL. Severe herpesvirus infections in an adolescent without natural killer cells. N. Engl. J. Med. 1989;320:1731–1735. - PubMed
Publication types
MeSH terms
Substances
LinkOut - more resources
Full Text Sources
Molecular Biology Databases
Research Materials


