Cannabinoids inhibit HIV-1 Gp120-mediated insults in brain microvascular endothelial cells - PubMed (original) (raw)
Cannabinoids inhibit HIV-1 Gp120-mediated insults in brain microvascular endothelial cells
Tzong-Shi Lu et al. J Immunol. 2008.
Abstract
HIV-1 infection has significant effect on the immune system as well as on the nervous system. Breakdown of the blood-brain barrier (BBB) is frequently observed in patients with HIV-associated dementia (HAD) despite lack of productive infection of human brain microvascular endothelial cells (HBMEC). Cellular products and viral proteins secreted by HIV-1 infected cells, such as the HIV-1 Gp120 envelope glycoprotein, play important roles in BBB impairment and HIV-associated dementia development. HBMEC are a major component of the BBB. Using cocultures of HBMEC and human astrocytes as a model system for human BBB as well as in vivo model, we show for the first time that cannabinoid agonists inhibited HIV-1 Gp120-induced calcium influx mediated by substance P and significantly decreased the permeability of HBMEC as well as prevented tight junction protein down-regulation of ZO-1, claudin-5, and JAM-1 in HBMEC. Furthermore, cannabinoid agonists inhibited the transmigration of human monocytes across the BBB and blocked the BBB permeability in vivo. These results demonstrate that cannabinoid agonists are able to restore the integrity of HBMEC and the BBB following insults by HIV-1 Gp120. These studies may lead to better strategies for treatment modalities targeted to the BBB following HIV-1 infection of the brain based on cannabinoid pharmacotherapies.
Figures
FIGURE 1
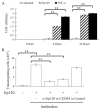
The effect of HIV-1 Gp120 and TNF-α on the fluid phase permeability of HBMEC. A, HBMEC were cultured to confluence on Transwell polycarbonate membranes and were incubated with HIV-1 Gp120 (10 ng/ml) or with TNF-α (10 ng/ml) for 6 and 24 h, as indicated. After 4 h of exposure to Lucifer Yellow (LY), the amount of LY in the lower chamber was measured. Control cells, untreated for each time point, were also used in measuring LY. The results are the mean ± SD of three experiments. **, p < 0.01 B, Monocyte transmigration across HBMEC monolayers. Cells were untreated (−) (control) or treated (+) with Gp120 (10 ng/ml). For treatment with Abs, mAbs against Gp120 (_α_-Gp120; used at 20 _μ_g/ml), CXCR4 Ab (_α_-CXCR4), or isotype control Abs (_α_-Control) were used (at a concentration of 30 _μ_g/ml). Abs were added to the HBMEC monolayers for 2 h before fresh isolated monocytes were added to the upper chamber. Monocytes transmigrated across the HBMEC were counted (n = 4 per condition). The results are the mean ± SD of three experiments. **, p < 0.01.
FIGURE 2
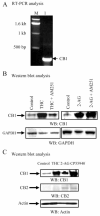
CB1 cannabinoid receptor expression analysis in HBMEC. A, RNA expression by RT-PCR analysis. Total RNA was extracted from HBMEC. Using the Titanium One-Step RT-PCR kit (BD Biosciences), the primer sequences for CB1 were 5′-GCCTGGCGGTGGCAGACCTCC-3′ (sense) and 5′-GCAGCACGGCGATCACAATGG-3′ (antisense). The size of the cDNA fragment obtained by RT-PCR was 278 bp for CB1. Lane M, m.w. standards. Lane 1, CB1 cannabinoid receptor; B, Protein expression analysis by Western blot (WB) assay of HBMEC. Total cell lysates were obtained from HBMEC that were either untreated or treated for 4 h with the cannabinoid agonists THC (10 nM) or the endogenous cannabinoid agonist 2-AG (10 nM). In some lanes, HBMEC were pretreated with the CB1 specific inhibitor AM251 (4 h at 10 nM). Cell lysates were analyzed by Western blotting with specific Abs against CB1 (Santa Cruz Biotechnology). For equal loading, we used GAPDH as control. C, Protein expression analysis of CB1 and CB2 by Western blot assay in HBMEC. Total cell lysates obtained from untreated HBMEC or HBMEC treated with exogenous cannabinoid agonist THC (4 h; 10 nM) or CP55940 (1 h; 1 ng/ml) or with the endogenous cannabinoid agonist 2-AG (1 h at 10 nM), as indicated.
FIGURE 3
The effects of cannabinoids on calcium ion flux alterations following SP treatment of HBMEC. A, A calcium ion flux alteration assay was performed following SP treatment in HBMEC. a, The calcium ion concentration in the HBMEC control; b, the calcium ion concentration of HBMEC following treatment with SP (5 min at 5 ng/ml); c, the calcium ion concentration of HBMEC treated with CP55940 (1 h at 1 ng/ml); d, the calcium ion concentration of HBMEC treated with CP55940 (1 h; 1 ng/ml) followed by SP treatment (5 min at 5 ng/ml). B, Measurement of Ca2+ concentration ratio in HBMEC samples.
FIGURE 4
Immunocytochemistry analysis of ZO-1 and claudin-5 expression in HBMEC following HIV-1 Gp120 treatment and inhibition of TJ down-regulation by cannabinoid agonists. A and B, Analysis of TJ protein (ZO-1) (A) and claudin-5 (B) expression by immunocytochemistry staining in HBMEC. HBMEC were fixed, permeabilized, and stained with specific Abs against ZO-1 and claudin-5 (as indicated by the yellow arrow). HBMEC were either incubated with PBS or treated with Gp120 (10 ng/ml for 6 h). In some cultures, HBMEC were pretreated with the exogenous cannabinoid agonist CP55940 (1 h at 1 ng/ml), as indicated. This is a representative experiment of nine. C, Quantitative analysis of TJ in HBMEC. The tight junctions of the samples were analyzed, quantitated, and compared with control untreated HBMEC. The TJ in control HBMEC were defined as 100%. Changes in TJ induced by Gp120 or Gp120 plus CP55940 (Gp120 + CP55940) were compared with control HBMEC and quantitated as the percentage of change in treated samples as compared with control HBMEC. Data are presented as the mean ± SD of five experiments. *, p < 0.05; **, p < 0.01. D, Effects of HIV-1 Gp120 on JAM-1, claudin-5, and ZO-1 expression in HBMEC in the presence of cannabinoid agonists by Western blot (WB) assay. Protein expression in HBMEC was examined by Western blot analysis. Total cell lysates were obtained from either untreated HBMEC or HBMEC treated with Gp120 (6 h at 10 ng/ml) in the presence or absence of the cannabinoid agonist CP55940 (1 h at 1 ng/ml). The cell lysates were prepared and analyzed by Western blotting with the indicated specific Abs. This is a representative experiment of three. *, p < 0.05; **, p < 0.01; **a = p value between control and Gp120 groups; **b = p value between Gp120 and Gp120 plus CP55940 groups.
FIGURE 5
Inhibition of permeability alteration of brain microvascular endothelial cells following HIV-1 Gp120 treatment in a human BBB model by cannabinoids. A–C, HIV-1 Gp120 (A and C; 10 ng/ml for 6 h) and SP (B; 1 ng/ml for 5 min) induced alterations in the permeability of HBMEC, as indicated by TEER. HBMEC cultures were treated with cannabinoid agonists such as CP55940 and ACEA (10−6 M for 1 h) in the presence (+) or absence (−) of cannabinoid antagonist CB1-specific inhibitor AM251 (1 h at 10 nM) or with SP inhibitor (1 h at 1 ng/ml) or URB597 (1 ng/ml for 1 h), as indicated. For treatments of cannabinoids plus Gp120, the cultures of HBMEC were treated with Gp120 (10 ng/ml for 6 h) plus cannabinoid compounds (as indicated above). The relative ratio of TEER in Gp120-treated samples as compared with untreated control HBMEC was measured for each sample; n = 8. The p values with asterisk (*, p < 0.05; **, p < 0.01) shows significant differences from specific groups. This is a representative experiment of eight. The value of TEER with medium alone was 937.7 ± 9.4. The results are expressed as mean percent of controls ± SD. D, Inhibition of SP secretion by cannabinoids in a human BBB model following Gp120 treatment. Cannabinoid compounds (ACEA and CP55940), in the presence (+) or absence (−) of CB1-specific inhibitor AM251, were added to HBMEC in BBB cocultures as indicated. Bars represent the mean ± SD; n = 3. The p values with asterisk (**, p < 0.01) show significant differences from the indicated specific groups. This is a representative experiment of three.
FIGURE 6
Cannabinoids restore on ZO-1 localization in HBMEC following exposure to Gp120. A, HBMEC were fixed, permeabilized, and stained with specific Abs against ZO-1 and CB1. HBMEC were treated with Gp120 (6 h at 10 ng/ml) alone (−) or together (+) with the cannabinoid agonist CP55940 (1 h at 1 ng/ml), as indicated. The merged figure indicates the protein expression of ZO-1 (yellow arrow) and CB1. B, ZO-1/CB1 colocalization analysis at randomly selected spots in the HBMEC membrane. The green curve indicates the expression of CB1 and the red curve indicates the expression of ZO-1. This is a representative experiment of three. C, Association of CB1 and ZO-1 is increased in the presence of cannabinoids. Total cell lysates were obtained from either untreated HBMEC or HBMEC treated with Gp120 (6 h at 10 ng/ml) in the presence (+) or absence (−) of the cannabinoid agonist CP55940 (1 h; 1 ng/ml). Total cell lysates were immunoprecipitated with control Ab, CB1 Ab, or ZO-1 Ab. The immunoprecipitates were then analyzed by SDS-PAGE and blotted with CB1 or ZO-1 Abs as indicated (IP, immunoprecipitation; WB, Western blot analysis). D, 293T cells were transfected with ZO-1, GFP-ZO-1 N terminus or GFP-ZO-1 C terminus and/or CB1 cDNA constructs as indicated. Cell lysates were prepared and immunoprecipitated as shown. The immunocomplexes were analyzed by SDS-PAGE and Western blotting with the indicated specific Abs.
FIGURE 7
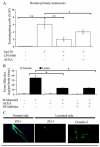
A, Inhibition of monocyte migration across the BBB model consisting of cocultures of HBMEC and human astrocytes by cannabinoids. HBMEC were treated with Gp120 (10 ng/ml) or with Gp120 (10 ng/ml) and cannabinoid agonists (CP55940 or ACEA) for 4 h as indicated. Human monocytes (200,000 cells) were applied to the upper wells of the coculture of the BBB. The cells in the lower compartments were collected and counted after 2 h. The _y_-axis represents the number of monocytes that migrated across the BBB model. Bars represent the means ± SD; n = 4. The p values with asterisk (*, p < 0.05; **, p < 0.01) show significant differences from specific groups. This is a representative experiment of five. B, Effects of cannabinoids on the integrity of the BBB in vivo. The extravasation of EB dye in the brain was eluted and measured by a spectrophotometer at 620 nm, following 1.6 M
d
-mannitol infusion in mice. The means ± SD in each group were analyzed statistically by one-way ANOVA and Tukey’s multiple comparison test. The p values with asterisk (*, p < 0.05) show significant differences between the specific groups as indicated; n = 8 per group per treatment. C, Immunohistochemistry analysis of TJ in mice. Brain sections were fixed, permeabilized, and stained with specific Abs against ZO-1 and claudin-5 after
d
-mannitol treatment in mice. These are representative immunostainings of one sample of 10 different brain sections.
FIGURE 8
Proposed mechanisms by which Gp120 affects the CNS.
Similar articles
- HIV-1 gp120 induces cytokine expression, leukocyte adhesion, and transmigration across the blood-brain barrier: modulatory effects of STAT1 signaling.
Yang B, Akhter S, Chaudhuri A, Kanmogne GD. Yang B, et al. Microvasc Res. 2009 Mar;77(2):212-9. doi: 10.1016/j.mvr.2008.11.003. Epub 2008 Nov 28. Microvasc Res. 2009. PMID: 19103208 Free PMC article. - HIV-1 gp120 compromises blood-brain barrier integrity and enhances monocyte migration across blood-brain barrier: implication for viral neuropathogenesis.
Kanmogne GD, Schall K, Leibhart J, Knipe B, Gendelman HE, Persidsky Y. Kanmogne GD, et al. J Cereb Blood Flow Metab. 2007 Jan;27(1):123-34. doi: 10.1038/sj.jcbfm.9600330. Epub 2006 May 10. J Cereb Blood Flow Metab. 2007. PMID: 16685256 Free PMC article. - HIV-1 gp120 proteins and gp160 peptides are toxic to brain endothelial cells and neurons: possible pathway for HIV entry into the brain and HIV-associated dementia.
Kanmogne GD, Kennedy RC, Grammas P. Kanmogne GD, et al. J Neuropathol Exp Neurol. 2002 Nov;61(11):992-1000. doi: 10.1093/jnen/61.11.992. J Neuropathol Exp Neurol. 2002. PMID: 12430716 - HIV infection of human brain capillary endothelial cells--implications for AIDS dementia.
Moses AV, Nelson JA. Moses AV, et al. Adv Neuroimmunol. 1994;4(3):239-47. doi: 10.1016/s0960-5428(06)80262-7. Adv Neuroimmunol. 1994. PMID: 7533040 Review.
Cited by
- Inhibition of telomerase activity alters tight junction protein expression and induces transendothelial migration of HIV-1-infected cells.
Huang W, Rha GB, Chen L, Seelbach MJ, Zhang B, András IE, Bruemmer D, Hennig B, Toborek M. Huang W, et al. Am J Physiol Heart Circ Physiol. 2010 Apr;298(4):H1136-45. doi: 10.1152/ajpheart.01126.2009. Epub 2010 Feb 5. Am J Physiol Heart Circ Physiol. 2010. PMID: 20139322 Free PMC article. - Targeting brain microvascular endothelial cells: a therapeutic approach to neuroprotection against stroke.
Yu QJ, Tao H, Wang X, Li MC. Yu QJ, et al. Neural Regen Res. 2015 Nov;10(11):1882-91. doi: 10.4103/1673-5374.170324. Neural Regen Res. 2015. PMID: 26807131 Free PMC article. Review. - Methamphetamine and Cannabis: A Tale of Two Drugs and their Effects on HIV, Brain, and Behavior.
Saloner R, Fields JA, Marcondes MCG, Iudicello JE, von Känel S, Cherner M, Letendre SL, Kaul M, Grant I; Translational Methamphetamine AIDS Research Center (TMARC) Group. Saloner R, et al. J Neuroimmune Pharmacol. 2020 Dec;15(4):743-764. doi: 10.1007/s11481-020-09957-0. Epub 2020 Sep 15. J Neuroimmune Pharmacol. 2020. PMID: 32929575 Free PMC article. Review. - Molecular mechanisms of neuroinvasion by monocytes-macrophages in HIV-1 infection.
Gras G, Kaul M. Gras G, et al. Retrovirology. 2010 Apr 7;7:30. doi: 10.1186/1742-4690-7-30. Retrovirology. 2010. PMID: 20374632 Free PMC article. Review. - CB2 receptor activation inhibits melanoma cell transmigration through the blood-brain barrier.
Haskó J, Fazakas C, Molnár J, Nyúl-Tóth Á, Herman H, Hermenean A, Wilhelm I, Persidsky Y, Krizbai IA. Haskó J, et al. Int J Mol Sci. 2014 May 8;15(5):8063-74. doi: 10.3390/ijms15058063. Int J Mol Sci. 2014. PMID: 24815068 Free PMC article.
References
- Hawkins BT, Davis TP. The blood-brain barrier/neurovascular unit in health and disease. Pharmacol. Rev. 2005;57:173–185. - PubMed
- Harhaj NS, Antonetti DA. Regulation of tight junctions and loss of barrier function in pathophysiology. Int. J. Biochem. Cell Biol. 2004;36:1206–1237. - PubMed
- Wolburg H, Lippoldt A. Tight junctions of the blood-brain barrier: development, composition and regulation. Vascul. Pharmacol. 2002;38:323–337. - PubMed
- Pardridge WM. Brain metabolism: a perspective from the blood-brain barrier. Physiol. Rev. 1983;63:1481–1535. - PubMed
Publication types
MeSH terms
Substances
LinkOut - more resources
Full Text Sources
Other Literature Sources
Medical


