Dichotomous anatomical properties of adult striatal medium spiny neurons - PubMed (original) (raw)
Dichotomous anatomical properties of adult striatal medium spiny neurons
Tracy S Gertler et al. J Neurosci. 2008.
Abstract
Principal medium spiny projection neurons (MSNs) of the striatum have long been thought to be homogeneous in their somatodendritic morphology and physiology. Recent work using transgenic mice, in which the two major classes of MSN are labeled, has challenged this assumption. To explore the basis for this difference, D(1) and D(2) receptor-expressing MSNs (D(1) and D(2) MSNs) in brain slices from adult transgenic mice were characterized electrophysiologically and anatomically. These studies revealed that D(1) MSNs were less excitable than D(2) MSNs over a broad range of developmental time points. Although M(1) muscarinic receptor signaling was a factor, it was not sufficient to explain the dichotomy between D(1) and D(2) MSNs. Reconstructions of biocytin-filled MSNs revealed that the physiological divergence was paralleled by a divergence in total dendritic area. Experimentally grounded simulations suggested that the dichotomy in MSN dendritic area was a major contributor to the dichotomy in electrophysiological properties. Thus, rather than being an intrinsically homogenous population, striatal MSNs have dichotomous somatodendritic properties that mirror differences in their network connections and biochemistry.
Figures
Figure 1.
Identification of D1 and D2 MSNs. a, A sagittal slice taken from a P40 FVB mouse. Ctx, Cortex; Cpu, caudate putamen; GP, globus pallidus; ec, external capsule; ic, internal capsule. b, Confocal image of eGFP-positive MSNs from a BAC transgenic animal. c, Visualized whole-cell recordings were made with contrast-enhanced IR-DIC microscopy (see Materials and Methods). d, Single-cell RT-PCR (scRT-PCR) verification of substance P (sp) and enkephalin (enk) expression in D1 and D2 spiny neurons. e, f, Injection of Cholera toxin subunit B-Alexa 647 into the SNr of BAC D1 and D2-eGFP mice displays overlapping and mutually exclusive populations of MSNs.
Figure 2.
Differences in the membrane properties of D1 and D2 MSNs. a, b, Rheobase current is significantly higher in D1 MSNs (D1 MSNs: median, 270 pA, n = 35; D2 MSNs: median, 130 pA, n = 31; p < 0.001). c, Resting membrane potential is significantly more depolarized in D2 MSNs (D1 MSNs: median, −87.2 mV, n = 35; D2 MSNs: median, −85.4 mV, n = 31; p < 0.05). d, Spike threshold is not significantly different. e, Input resistance measured with a −150 pA hyperpolarizing step is significantly smaller in D1 MSNs (D1 MSNs: median, 53.1 MΩ, n = 35; D2 MSNs: median, 93.1 MΩ, n = 31; p < 0.05). e, f, Membrane time constant and resistance measured with a 5 mV pulse in voltage clamp from −80 mV are significantly different (Rm: D1 MSNs: median, 124.40 MΩ, n = 35; D2 MSNs: median, 154.83 MΩ, n = 31; p < 0.05; τ: D1 MSNs: median, 2.9 ms, n = 28; D2 MSNs: median, 2.3 ms, n = 30; p < 0.05). h, i, Membrane responses to intrasomatic current injection reveal a subthreshold divergence. A linear fit across resting membrane potential reveals a difference in input resistance. j, Voltage responses of D1 and D2 MSNs to intrasomatic current steps demonstrate increased excitability in the D2 MSN population, as displayed in an F–I plot. *Statistical significance.
Figure 3.
Differences in Kir2 channel current amplitude and whole-cell capacitance between D1 and D2 MSNs. a, Sample voltage-clamp recording of a spiny neuron, with a focus on the inwardly rectifying Kir2 current present during a voltage ramp. b, Mean current–voltage relationships of D1 (red) and D2 (blue) MSNs as measured with a 200 ms ramp, displayed with shaded SEM. Note the divergence of the two populations, with a difference current (inset) mirroring the Kir2 current rectification and reversal profile. Arrow indicates _E_K. c, Overlapping, yet significantly different, Gaussian distributions of whole-cell capacitance measurements taken from D1 and D2 MSNs (D1 MSN: median, 192 pF, n = 28; D2 MSN: median, 157 pF, n = 30; p < 0.05). d, Peak Kir2/K leak channel conductance (measured with −150 mV step; see arrow in a) is positively correlated to whole-cell capacitance in D1 and D2 MSNs.
Figure 4.
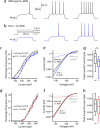
The difference between D1 and D2 MSNs is stable through development. a, Current-clamp recordings from D1 MSNs spiny throughout development. b, Rheobase current increases for all MSNs through 10 weeks of age. c, Peak inward current, as measured by a voltage step from −80 to −150 mV in voltage-clamp mode, also increases for both MSN subtypes through development.
Figure 5.
Basal muscarinic tone suppresses the excitability of D2 MSNs but is insufficient to explain the physiological dichotomy. a, b, Sample current-clamp recordings from wild-type and M1R −/− D2 spiny neurons. c, d, F–I relationships of D1 and D2 wild-type and M1R −/− MSNs. Note the decrease in firing in the D2 MSN population from M1R −/− mice. e, f, I–V relationships of wild-type versus M1R −/− D1 MSNs and wild-type (wt) versus D2 MSNs. g, h, Peak current measured at −150 mV does not differ in the D1 MSNs. (D1 MSN wt: median, −1836 pA, n = 35; D1 MSN M1R −/−: median, −2045 pA, n = 14). M1R −/− D2 MSNs show increased inward currents in the absence of M1R tone (D2 MSN wt: median, −1159 pA, n = 31; D2 MSN M1R −/−: median, −1298 pA, n = 14; p < 0.05). *Statistical significance.
Figure 6.
Reconstructions of biocytin-filled D1 and D2 MSNs. a–c, Striatal neurons from P35–P45 BAC transgenic mice were biocytin-filled, imaged, and reconstructed in three dimensions. A GABAergic interneuron is included for comparison. d, Fan-in diagrams displayed no apparent preferred orientation in either the D1 or D2 MSN populations. e, Dendrograms displaying in two dimensions the length, number, and connectivity of dendritic segments in sample neurons.
Figure 7.
Analysis of anatomical differences between reconstructed D1 and D2 MSNs. a, A three-dimensional Sholl analysis of biocytin-filled and reconstructed neurons from P35–P45 BAC transgenic mice. Data are shown as mean (±SEM) number of intersections at 1 μm eccentricities from the soma for 15 D1 and 16 D2 MSNs. D1 MSNs have a more highly branched dendritic tree, as indicated by the increased number of intersections and positive subtracted area (gray shading). b, Mean cumulative dendritic length at 1 μm eccentricities for D1 and D2 MSN populations. Bottom, Note that the percentage difference (Diff) between populations in cumulative total dendritic length increases and remains at ∼20% (arrow and fit line) within 30 μm from the soma. Inset, The total dendritic length in each cell/number of primary dendrites is not significantly different between populations (D1 MSN: median, 398.8 μm, n = 15; D2 MSN: median, 400.5 μm, n = 16). c, Whole-cell capacitance is positively correlated to total dendritic length (rS = 0.45, p < 0.05). d, D1 MSNs have significantly more primary dendrites (D1 MSN: median, 8, n = 15; D2 MSN: median, 6, n = 16; p < 0.05), branch points (D1 MSN: median, 28, n = 15; D2 MSN: median, 19, n = 16; p < 0.05), tips (D1 MSN: median, 38, n = 16; D2 MSN: median, 28, n = 15; p < 0.001), and total dendritic length (D1 MSN: median, 3385.6 μm, n = 15; D2 MSN: median, 2878.3 μm, n = 16; p < 0.001). *Statistical significance.
Figure 8.
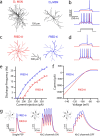
Simulations suggest that the differences in D1 and D2 MSN physiology reflect the dendritic dichotomy. a, b, NEURON models constrained to anatomical reconstructions of biocytin-filled and imaged spiny projection neurons, fit with identical channel distributions and densities, display different excitability in current-clamp simulations. The D1 MSN reconstruction model had a whole-cell capacitance of 203 pF (recorded in vitro, 209 pF) and a rheobase current of 210 pF, compared with the D2 MSN reconstruction model with a whole-cell capacitance of 182 pF (recorded in vitro, 168 pF) and a rheobase current of 160 pA. c, d, FRED NEURON models constructed with eight or six primary dendrites to simulate a D1 and D2 MSN, respectively. FRED-8 (whole-cell capacitance, 213 pF) and FRED-6 (whole-cell capacitance, 173 pF) have rheobase currents of 210 and 165 pF, respectively. e, A frequency–current plot demonstrating increased firing frequency in FRED-8 for all levels of intrasomatic current injection. f, Current–voltage relationships displaying a Kir2 current of increased amplitude in the FRED-8 model. g, Somatic depolarization in FRED-6 and FRED-8 models from an AMPA-mediated PSP to a single tertiary dendrite and to five tertiary dendrites at 50 Hz with and without Kir2 channels.
Similar articles
- Differential excitability and modulation of striatal medium spiny neuron dendrites.
Day M, Wokosin D, Plotkin JL, Tian X, Surmeier DJ. Day M, et al. J Neurosci. 2008 Nov 5;28(45):11603-14. doi: 10.1523/JNEUROSCI.1840-08.2008. J Neurosci. 2008. PMID: 18987196 Free PMC article. - Recurrent collateral connections of striatal medium spiny neurons are disrupted in models of Parkinson's disease.
Taverna S, Ilijic E, Surmeier DJ. Taverna S, et al. J Neurosci. 2008 May 21;28(21):5504-12. doi: 10.1523/JNEUROSCI.5493-07.2008. J Neurosci. 2008. PMID: 18495884 Free PMC article. - Dopamine facilitates dendritic spine formation by cultured striatal medium spiny neurons through both D1 and D2 dopamine receptors.
Fasano C, Bourque MJ, Lapointe G, Leo D, Thibault D, Haber M, Kortleven C, Desgroseillers L, Murai KK, Trudeau LÉ. Fasano C, et al. Neuropharmacology. 2013 Apr;67:432-43. doi: 10.1016/j.neuropharm.2012.11.030. Epub 2012 Dec 8. Neuropharmacology. 2013. PMID: 23231809 - D1 and D2 dopamine-receptor modulation of striatal glutamatergic signaling in striatal medium spiny neurons.
Surmeier DJ, Ding J, Day M, Wang Z, Shen W. Surmeier DJ, et al. Trends Neurosci. 2007 May;30(5):228-35. doi: 10.1016/j.tins.2007.03.008. Epub 2007 Apr 3. Trends Neurosci. 2007. PMID: 17408758 Review. - Striatal plasticity and medium spiny neuron dendritic remodeling in parkinsonism.
Deutch AY, Colbran RJ, Winder DJ. Deutch AY, et al. Parkinsonism Relat Disord. 2007;13 Suppl 3(Suppl 3):S251-8. doi: 10.1016/S1353-8020(08)70012-9. Parkinsonism Relat Disord. 2007. PMID: 18267246 Free PMC article. Review.
Cited by
- D1R- and D2R-Medium-Sized Spiny Neurons Diversity: Insights Into Striatal Vulnerability to Huntington's Disease Mutation.
Bergonzoni G, Döring J, Biagioli M. Bergonzoni G, et al. Front Cell Neurosci. 2021 Feb 10;15:628010. doi: 10.3389/fncel.2021.628010. eCollection 2021. Front Cell Neurosci. 2021. PMID: 33642998 Free PMC article. Review. - Early Sensory Deprivation Leads to Differential Inhibitory Changes in the Striatum During Learning.
Paraouty N, Mowery TM. Paraouty N, et al. Front Neural Circuits. 2021 May 28;15:670858. doi: 10.3389/fncir.2021.670858. eCollection 2021. Front Neural Circuits. 2021. PMID: 34122017 Free PMC article. - Dopamine Oppositely Modulates State Transitions in Striosome and Matrix Direct Pathway Striatal Spiny Neurons.
Prager EM, Dorman DB, Hobel ZB, Malgady JM, Blackwell KT, Plotkin JL. Prager EM, et al. Neuron. 2020 Dec 23;108(6):1091-1102.e5. doi: 10.1016/j.neuron.2020.09.028. Epub 2020 Oct 19. Neuron. 2020. PMID: 33080228 Free PMC article. - Utility of genetically modified mice for understanding the neurobiology of substance use disorders.
Fowler CD, Kenny PJ. Fowler CD, et al. Hum Genet. 2012 Jun;131(6):941-57. doi: 10.1007/s00439-011-1129-z. Epub 2011 Dec 22. Hum Genet. 2012. PMID: 22190154 Free PMC article. Review. - Spatial distribution of D1R- and D2R-expressing medium-sized spiny neurons differs along the rostro-caudal axis of the mouse dorsal striatum.
Gangarossa G, Espallergues J, Mailly P, De Bundel D, de Kerchove d'Exaerde A, Hervé D, Girault JA, Valjent E, Krieger P. Gangarossa G, et al. Front Neural Circuits. 2013 Jul 29;7:124. doi: 10.3389/fncir.2013.00124. eCollection 2013. Front Neural Circuits. 2013. PMID: 23908605 Free PMC article.
References
- Baranauskas G, Tkatch T, Nagata K, Yeh JZ, Surmeier DJ. Kv3.4 subunits enhance the repolarizing efficiency of Kv3.1 channels in fast-spiking neurons. Nat Neurosci. 2003;6:258–266. - PubMed
- Bean BP. The action potential in mammalian central neurons. Nat Rev Neurosci. 2007;8:451–465. - PubMed
Publication types
MeSH terms
Substances
Grants and funding
- R01 NS034696/NS/NINDS NIH HHS/United States
- F30 MH082522/MH/NIMH NIH HHS/United States
- P50 MH074866/MH/NIMH NIH HHS/United States
- F30MH082522/MH/NIMH NIH HHS/United States
- F30 MH082522-02/MH/NIMH NIH HHS/United States
- NS34696/NS/NINDS NIH HHS/United States
- R37 NS034696/NS/NINDS NIH HHS/United States
- P50MH074866/MH/NIMH NIH HHS/United States
LinkOut - more resources
Full Text Sources
Other Literature Sources
Molecular Biology Databases
Research Materials
Miscellaneous


