Focal cerebral ischemia in the TNFalpha-transgenic rat - PubMed (original) (raw)
Focal cerebral ischemia in the TNFalpha-transgenic rat
L Creed Pettigrew et al. J Neuroinflammation. 2008.
Abstract
Background: To determine if chronic elevation of the inflammatory cytokine, tumor necrosis factor-alpha (TNFalpha), will affect infarct volume or cortical perfusion after focal cerebral ischemia.
Methods: Transgenic (TNFalpha-Tg) rats overexpressing the murine TNFalpha gene in brain were prepared by injection of mouse DNA into rat oocytes. Brain levels of TNFalpha mRNA and protein were measured and compared between TNFalpha-Tg and non-transgenic (non-Tg) littermates. Mean infarct volume was calculated 24 hours or 7 days after one hour of reversible middle cerebral artery occlusion (MCAO). Cortical perfusion was monitored by laser-Doppler flowmetry (LDF) during MCAO. Cortical vascular density was quantified by stereology. Post-ischemic cell death was assessed by immunohistochemistry and regional measurement of caspase-3 activity or DNA fragmentation. Unpaired t tests or analysis of variance with post hoc tests were used for comparison of group means.
Results: In TNFalpha-Tg rat brain, the aggregate mouse and rat TNFalpha mRNA level was fourfold higher than in non-Tg littermates and the corresponding TNFalpha protein level was increased fivefold (p <or= 0.01). Infarct volume was greater in TNFalpha-Tg rats than in non-Tg controls at 24 hours (p <or= 0.05) and 7 days (p <or= 0.01). Within the first 10 minutes of MCAO, cortical perfusion measured by LDF was reduced in TNFalpha-Tg rats (p <or= 0.05). However, regional vascular density was equivalent between TNFalpha-Tg and non-Tg animals (p = NS). Neural cellular apoptosis was increased in transgenic animals as shown by elevated caspase-3 activity (p <or= 0.05) and DNA fragmentation (p <or= 0.001) at 24 hours.
Conclusion: Chronic elevation of TNFalpha protein in brain increases susceptibility to ischemic injury but has no effect on vascular density. TNFalpha-Tg animals are more susceptible to apoptotic cell death after MCAO than are non-Tg animals. We conclude that the TNFalpha-Tg rat is a valuable new tool for the study of cytokine-mediated ischemic brain injury.
Figures
Figure 1
Structure of the murine TNFα transgenic construct and confirmation of genotype. The structure of the murine TNFα transgenic construct is illustrated in Panel a. An example of polymerase chain reaction (PCR) products stained with ethidium bromide to confirm the genotype of the TNFα-transgenic (TNFα-Tg) rat is shown in Panel b. Clear boxes in the drawing of the transgenic construct represent untranslated sequences from the mouse TNFα gene, black boxes indicate the coding region of the TNFα gene, and the gray box (including the remainder of the EcoRI to SalI fragment) represent the human β-globin 3' fragment. BS indicates pBluescript vector. Panel b shows PCR products in tail snip tissue taken from a TNFα-Tg rat (Lane a), a non-transgenic littermate (Lane b), and a Sprague-Dawley rat (Lane c). A 501 bp fragment of the murine TNFα gene was detected only in the transgenic rat.
Figure 2
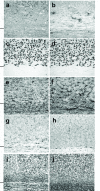
Cellular expression of TNFα protein in transgenic and non-transgenic rat brain. This photographic collage shows cellular expression of TNFα protein and compares the brain anatomy of transgenic and non-transgenic (non-Tg) rats that were not subjected to ischemic injury. Coronal brain sections were incubated with primary antibodies identifying mouse or rat TNFα protein (Panels a and b), neurons (Panels c and d), astroglia (Panels e and f), microglia/macrophages (Panels g and h), or oligodendroglia (Panels i and j). All light microscopic images were taken at 20× magnification. Transgenic rat brain is shown in Panels b, d, f, h, and j. All remaining images are of brain in non-Tg littermates. Cells that were immunoreactive for TNFα appeared only in transgenic animals, as shown in Panel b. A hash mark drawn to the left of each pair of 20× images represents the interface between neocortex and internal capsule. Scale bar = 100 μm
Figure 3
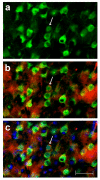
Identification of neural cell type containing TNFα protein. This photographic collage shows the result of co-localization studies identifying the neural cell type containing TNFα protein in the brain of the transgenic animal. All images were taken of TNFα-transgenic rat brain that had not been subjected to ischemic injury. Coronal brain sections were incubated with primary antibodies identifying mouse or rat TNFα protein and neurons. All images were made by fluorescence microscopy at 40× magnification. In Panel a, cortical neurons in TNFα-Tg rat brain are immuno-labeled with the anti-neuronal antibody NeuN tagged with a green fluorophore. In Panel b, co-localization images are merged to show that several NeuN-labeled neurons (green) express TNFα protein immuno-labeled with anti-mouse/rat TNFα antibody tagged with a red fluorophore. In Panel c, co-localization images are merged to show NeuN-labeled neurons (green), TNFα protein (red), and cellular nuclei labeled with Hoechst stain (blue). A representative neuron with cytoplasmic inclusions labeled to show expression of TNFα protein is identified in each Panel (arrow). In Panel c, nuclei of several non-neuronal cells that do not express TNFα protein are shown. Scale bar = 50 μm
Figure 4
Organ-specific expression of TNFα mRNA and protein in transgenic and non-transgenic rats. Two bar graphs show aggregate rat and mouse TNFα mRNA (Panel a) or protein (Panel b) in brain homogenates prepared from transgenic animals and non-transgenic (non-Tg) littermates (n = 3 in each group). A third bar graph (Panel c) shows TNFα protein levels in three brain compartments, various external organs, and randomly obtained serum samples from a second set of transgenic and non-Tg animals (n = 3 in each group). No animal was subjected to ischemic brain injury. In Panel a, the mean ± SD level of TNFα mRNA was significantly higher in transgenic rats (p ≤ 0.01; unpaired t test). The mean TNFα protein level was also significantly elevated in transgenic animals, as shown in Panel b (p ≤ 0.01; unpaired t test). When TNFα protein was surveyed in multiple organs and in serum, its content in cortex and brainstem was at least fivefold higher than in non-Tg animals (p ≤ 0.001; ANOVA/Fisher's test). **p ≤ 0.01; ***p ≤ 0.001
Figure 5
Quantification of brain infarct volume in TNFα-transgenic and non-transgenic rats at 24 hours. Representative infarcts are shown in the brain of a non-transgenic (Panel a) and a TNFα-transgenic (TNFα-Tg) rat (Panel b). In Panel c, a bar graph shows mean percent infarct volume in both TNFα-Tg and non-Tg rats. All animals underwent suture-occlusion of the right middle cerebral artery for one hour followed by 24 hours of post-ischemic reperfusion. The 1-mm coronal brain sections in Panels a and b were stained for triphenyltetrazolium chloride. Panel a shows infarction (blanched tissue) confined to the right cortical mantle and a portion of the underlying striatum in a non-Tg rat. In the transgenic animal shown in Panel b, there is blanching of tissue in the right cortical mantle that indicates completed infarction and mottled discoloration throughout the entire ipsilateral striatum that is a maturing infarct. Panel c shows that mean ± SD infarct volume in the transgenic group (n = 12) was significantly greater than that of the non-Tg group (n = 17; *p ≤ 0.05; unpaired t test). All volume measurements were corrected for tissue edema.
Figure 6
Quantification of brain infarct volume in TNFα-transgenic and non-transgenic rats at 7 days. Representative infarcts are shown in the brain of a non-transgenic (non-Tg; Panel a) and a TNFα-transgenic (TNFα-Tg) rat (Panel b). In Panel c, a bar graph shows mean ± SD infarct volume in both TNFα-Tg and non-Tg rats. All animals underwent suture-occlusion of the right middle cerebral artery for one hour followed by 7 days of post-ischemic reperfusion. The 80-μm coronal sections of brain shown in Panels a and b were stained with cresyl violet for Nissl substance. Panel a shows well-demarcated infarction confined to the right cortical mantle and a portion of the underlying striatum in the non-Tg rat. In the transgenic animal shown in Panel b, the infarct occupies a larger proportion of the right cortical mantle and almost all of the ipsilateral striatum. Panel c shows that mean infarct volume in the transgenic group (n = 10) was significantly greater than that of the non-Tg group (n = 11; **p ≤ 0.01; unpaired t test).
Figure 7
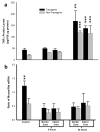
Regional expression of TNFα mRNA and protein in brain after focal ischemia. Two bar graphs show mean ± SD levels of TNFα protein (Panel a) and the corresponding mean ratios of mouse to rat TNFα mRNA (Panel b) in transgenic and non-transgenic rat brain with or without ischemic brain injury. TNFα-transgenic (TNFα-Tg) and non-Tg rats underwent one hour of focal brain ischemia achieved by unilateral middle cerebral artery occlusion (MCAO). Tissue samples were obtained from the developing infarct core and the border zone approximating the ischemic penumbra in both groups of animals after 3 or 24 hours of post-ischemic reperfusion. As shown in Panel a, mean TNFα levels were significantly elevated within the border zone and infarct core after 24 hours of reperfusion in both TNFα-Tg and non-Tg rats, in comparison to animals of the respective type whether non-ischemic controls or ischemic rats sampled 3 hours after reversal of MCAO (n = 3 – 4 per group; p ≤ 0.001 for all pairwise comparisons; ANOVA/Fisher's test). The mean TNFα level in the border zone adjacent to the infarct core in the transgenic rat at 24 hours was significantly higher than the comparable level in the non-Tg animal (p ≤ 0.01; ANOVA/Fisher's test). Panel b of Figure 5 shows the mean ratios of mouse and rat TNFα mRNA corresponding to the TNFα protein levels from the same animals reported in Panel a. The mean ratio of mouse/rat TNFα mRNA was significantly higher in TNFα-Tg rats compared to the non-Tg animals only under control conditions without ischemia (p ≤ 0.01; ANOVA/Fisher's test). **p ≤ 0.01; ***p ≤ 0.001
Figure 8
Biological activity of TNFα in transgenic rat brain shown by TRADD protein expression. This bar graph shows expression of TNF receptor-associated protein death domain (TRADD) protein in brain homogenates obtained from TNFα-transgenic (TNFα-Tg) and non-Tg rats. Samples were obtained after 3 hours of reperfusion following one hour of focal cerebral ischemia. TRADD protein expression is shown as mean ± SD optical density units measured from digitized electrophoretic bands. In ischemic TNFα-Tg brain, TRADD protein was expressed more intensely within the border zone approximating the ischemic penumbra (n = 5 per group; p ≤ 0.01; ANOVA/Fisher's test) and in the developing infarct core (p ≤ 0.05; ANOVA/Fisher's test) when compared to non-Tg littermates. TRADD was also elevated significantly in the normally-perfused hemisphere (control) of the TNFα-Tg rat compared to non-Tg animals (p ≤ 0.01; ANOVA/Fisher's test), reflecting increased constitutive expression of protein in response to interaction between active, soluble TNFα and its p55/TNFR1 receptor. There were no significant differences between TRADD protein expression in the normally-perfused hemisphere and the ischemic border zone or infarct core in TNFα-Tg rats (p = NS). *p ≤ 0.05; **p ≤ 0.01
Figure 9
Co-localization studies identifying neuronal apoptosis after focal cerebral ischemia. A collage of 40× photomicrographs shows localization of activated caspase-3 (red) in NeuN-positive striatal neurons (green) after focal cerebral ischemia in TNFα-transgenic (TNFα-Tg) and non-Tg rats. Panels a and c are representative images of striatum in the left cerebral hemisphere of a non-Tg (a) and a TNFα-Tg (c) rat subjected to one hour of suture-occlusion of the right middle cerebral artery, followed by 24 hours of reperfusion. Note the absence of activated caspase-3 in NeuN-positive striatal neurons of the cerebral hemisphere contralateral to the ischemic injury in both animals. Panels b and d are taken from the ischemic striatum in the same non-Tg (b) and TNFα-Tg (d) rats. The presence of activated caspase-3 is clearly evident in NeuN-positive striatal neurons (arrows), many of which exhibit morphological changes consistent with ongoing cell death. Scale bar = 100 μm.
Figure 10
Co-localization study revealing apoptotic bodies within degenerating neuron in ischemic TNFα-transgenic rat brain. A single 40× photomicrograph shows localization of activated caspase-3 (red) in NeuN-positive cortical neurons (green) after focal cerebral ischemia in the TNFα-transgenic (TNFα-Tg) rat. The right cerebral cortex was sampled after one hour of suture occlusion of the ipsilateral middle cerebral artery, followed by 24 hours of reperfusion. In the representative NeuN-positive neuron identified by the arrow, there is caspase-3 activation with apoptotic bodies identified by Hoechst staining (blue). Scale bar = 50 μm.
Figure 11
Caspase-3 activity in TNFα-transgenic and non-transgenic rat brain after focal ischemia. The bar graph shows caspase-3 activity in the brains of TNFα-transgenic (TNFα-Tg) and non-Tg rats (n = 3 – 4 per group and sampling time) with or without ischemic brain injury. TNFα-transgenic (TNFα-Tg) and non-Tg rats underwent one hour of focal brain ischemia achieved by unilateral middle cerebral artery occlusion. Tissue samples were obtained from the developing infarct core and the border zone approximating the ischemic penumbra in both groups of animals after 3 or 24 hours of post-ischemic reperfusion. Caspase-3 activity is presented as Δ fluorescence units/minute/100 mg protein (mean ± SD). Transgenic animals had significantly greater caspase-3 activity in the border zone region after 3 hours of reperfusion and in the infarct core at both 3 and 24 hours (p ≤ 0.05; ANOVA/Fisher's test).*p ≤ 0.05 compared to respective control.
Figure 12
Quantification of apoptotic cell death by DNA fragmentation in TNFα-transgenic and non-transgenic rat brain after focal ischemia. The bar graph shows DNA fragmentation representing apoptotic cell death in brain sampled from TNFα-transgenic (TNFα-Tg) and non-Tg rats (n = 6 – 7 per group and sampling time) after one hour of unilateral middle cerebral artery occlusion (MCAO). Tissue samples were obtained from the developing infarct core and the border zone approximating the ischemic penumbra in both groups of animals after 3 or 24 hours of post-ischemic reperfusion. Neural cell death represented by DNA fragmentation is presented as mU/mg protein (mean ± SE). Cell death represented by DNA fragmentation was present at only negligible levels in non-ischemic TNFα-Tg and non-Tg controls (n = 12 per group) and after MCAO followed by 3 hours of post-ischemic reperfusion (p = NS for all pairwise comparisons). However, DNA fragmentation increased markedly after 24 hours of post-ischemic reperfusion in both TNFα-Tg and non-Tg rats. In the border zone approximating the ischemic penumbra in TNFα-Tg brain sampled at 24 hours, mean DNA fragmentation was increased by almost 200-fold compared to the respective non-ischemic control (p ≤ 0.0001; ANOVA/Fisher's test) and over 60-fold compared to border zone tissue sampled from TNFα-Tg brain at 3 hours (p ≤ 0.001; ANOVA/Fisher's test). DNA fragmentation in this region sampled from TNFα-Tg brain was almost 4-fold higher than that observed in non-Tg brain after 24 hours of post-ischemic reperfusion (p ≤ 0.01; ANOVA/Fisher's test). Within the infarct zone of TNFα-Tg brain sampled at 24 hours, mean DNA fragmentation was again increased by almost 200-fold compared to the respective non-ischemic control (p ≤ 0.0001; ANOVA/Fisher's test) and 60-fold compared to infarct zone tissue sampled from TNFα-Tg brain at 3 hours (p ≤ 0.001; ANOVA/Fisher's test). There was no significant difference observed between the elevated mean levels of DNA fragmentation within the infarct zone in TNFα-Tg and non-Tg rat brain after 24 hours of post-ischemic reperfusion (p = NS). **p ≤ 0.01; ***p ≤ 0.001; †p ≤ 0.0001
Figure 13
Measurement of cortical perfusion during focal cerebral ischemia in TNFα-transgenic and non-transgenic rats. The multi-line plot shows laser-Doppler flowmetry (LDF) measurements of cortical perfusion expressed as a percentage of pre-ischemic baseline in TNFα-transgenic (TNFα-Tg; n = 19) rats and non-Tg littermates (n = 21). Measurements were made every 5 minutes during 10 minutes of pre-ischemic baseline, 60 minutes of ischemia, and 30 minutes of post-ischemic reperfusion. Values were calculated as a percentage of pre-ischemic baseline and are presented as means ± SD. The TNFα-Tg rats had significantly lower mean LDF at 5 and 10 minutes immediately after the onset of ischemia (P = 0.0016 and 0.034, respectively; repeated measures ANOVA). *p ≤ 0.05; **p ≤ 0.01
Figure 14
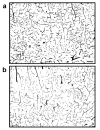
Micro-vascular structures in the brains of TNFα-transgenic and non-transgenic rats. These representative photomicrographs show ink-stained micro-vascular structures within the cortex of the TNFα-transgenic rat (Panel a) and a non-transgenic littermate (Panel b). There was no significant difference between samples in the number of micro-vascular structures quantified by stereology. Scale bar = 100 μm
Similar articles
- Focal cerebral ischemia and mitochondrial dysfunction in the TNFα-transgenic rat.
Pandya JD, Sullivan PG, Pettigrew LC. Pandya JD, et al. Brain Res. 2011 Apr 12;1384:151-60. doi: 10.1016/j.brainres.2011.01.102. Epub 2011 Feb 26. Brain Res. 2011. PMID: 21300036 Free PMC article. - SB 234551 selective ET(A) receptor antagonism: perfusion/diffusion MRI used to define treatable stroke model, time to treatment and mechanism of protection.
Legos JJ, Lenhard SC, Haimbach RE, Schaeffer TR, Bentley RG, McVey MJ, Chandra S, Irving EA, Andrew A Parsons, Barone FC. Legos JJ, et al. Exp Neurol. 2008 Jul;212(1):53-62. doi: 10.1016/j.expneurol.2008.03.011. Epub 2008 Mar 25. Exp Neurol. 2008. PMID: 18462720 - Increased expression of cysteinyl leukotriene receptor-1 in the brain mediates neuronal damage and astrogliosis after focal cerebral ischemia in rats.
Fang SH, Wei EQ, Zhou Y, Wang ML, Zhang WP, Yu GL, Chu LS, Chen Z. Fang SH, et al. Neuroscience. 2006 Jul 7;140(3):969-79. doi: 10.1016/j.neuroscience.2006.02.051. Epub 2006 May 2. Neuroscience. 2006. PMID: 16650938 - Multiple effects of 2ME2 and D609 on the cortical expression of HIF-1alpha and apoptotic genes in a middle cerebral artery occlusion-induced focal ischemia rat model.
Chen C, Hu Q, Yan J, Lei J, Qin L, Shi X, Luan L, Yang L, Wang K, Han J, Nanda A, Zhou C. Chen C, et al. J Neurochem. 2007 Sep;102(6):1831-1841. doi: 10.1111/j.1471-4159.2007.04652.x. Epub 2007 May 26. J Neurochem. 2007. PMID: 17532791 - Inflammation and the neurovascular unit in the setting of focal cerebral ischemia.
del Zoppo GJ. del Zoppo GJ. Neuroscience. 2009 Feb 6;158(3):972-82. doi: 10.1016/j.neuroscience.2008.08.028. Epub 2008 Aug 27. Neuroscience. 2009. PMID: 18824084 Free PMC article. Review.
Cited by
- Mice lacking the β2 adrenergic receptor have a unique genetic profile before and after focal brain ischaemia.
White RE, Palm C, Xu L, Ling E, Ginsburg M, Daigle BJ, Han R, Patterson A, Altman RB, Giffard RG. White RE, et al. ASN Neuro. 2012 Sep 7;4(5):e00096. doi: 10.1042/AN20110020. ASN Neuro. 2012. PMID: 22867428 Free PMC article. - Neural injury following stroke: are Toll-like receptors the link between the immune system and the CNS?
Downes CE, Crack PJ. Downes CE, et al. Br J Pharmacol. 2010 Aug;160(8):1872-88. doi: 10.1111/j.1476-5381.2010.00864.x. Br J Pharmacol. 2010. PMID: 20649586 Free PMC article. Review. - The protective role of proton-sensing TDAG8 in the brain injury in a mouse ischemia reperfusion model.
Sato K, Tobo A, Mogi C, Tobo M, Yamane N, Tosaka M, Tomura H, Im DS, Okajima F. Sato K, et al. Sci Rep. 2020 Oct 14;10(1):17193. doi: 10.1038/s41598-020-74372-7. Sci Rep. 2020. PMID: 33057165 Free PMC article. - Genetic ablation of soluble tumor necrosis factor with preservation of membrane tumor necrosis factor is associated with neuroprotection after focal cerebral ischemia.
Madsen PM, Clausen BH, Degn M, Thyssen S, Kristensen LK, Svensson M, Ditzel N, Finsen B, Deierborg T, Brambilla R, Lambertsen KL. Madsen PM, et al. J Cereb Blood Flow Metab. 2016 Sep;36(9):1553-69. doi: 10.1177/0271678X15610339. Epub 2015 Oct 19. J Cereb Blood Flow Metab. 2016. PMID: 26661199 Free PMC article.
References
- Mayne M, Ni W, Yan HJ, Xue M, Johnston JB, Del Bigio MR, Peeling J, Power C. Antisense oligodeoxynucleotide inhibition of tumor necrosis factor-alpha expression is neuroprotective after intracerebral hemorrhage. Stroke. 2001;32:240–248. - PubMed
- Tomimoto H, Ihara M, Wakita H, Ohtani R, Lin JX, Akiguchi I, Kinoshita M, Shibasaki H. Chronic cerebral hypoperfusion induces white matter lesions and loss of oligodendroglia with DNA fragmentation in the rat. Acta Neuropathol (Berlin) 2003;106:527–534. doi: 10.1007/s00401-003-0749-3. - DOI - PubMed
Publication types
MeSH terms
Substances
LinkOut - more resources
Full Text Sources
Medical
Research Materials
Miscellaneous


