Very small embryonic-like stem cells are present in adult murine organs: ImageStream-based morphological analysis and distribution studies - PubMed (original) (raw)
Very small embryonic-like stem cells are present in adult murine organs: ImageStream-based morphological analysis and distribution studies
Ewa K Zuba-Surma et al. Cytometry A. 2008 Dec.
Abstract
Recently, we purified a population of CXCR4+/Oct-4+/SSEA-1+/Sca-1+/Lin(-)/CD45(-) very small embryonic-like stem cells (VSELs) from adult murine bone marrow (BM). After using flow cytometry, ImageStream analysis, confocal microscopy, and real time RT-PCR, we report that similar cells could be also identified and isolated from several organs in adult mice. The highest total numbers of Oct-4+ VSELs were found in the brain, kidneys, muscles, pancreas, and BM. These observations support our hypothesis that a population of very primitive cells expressing germ line/epiblast markers (Oct-4, SSEA-1) is deposited early during embryogenesis in various organs and survives into adulthood. Further studies are needed to determine whether these cells, after being isolated from various adult human organs similarly to their murine BM-derived counterparts, are endowed with pluripotent stem cell properties.
Figures
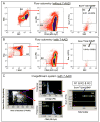
Figure 1. Flow cytometric and ISS analyses of cells isolated from murine organs
The schemes of analyses are based on a sample of cells isolated from thymus. Cells were stained with antibodies against CD45, Lin, and Sca-1 (BD Pharmingen) and freshly analyzed by MoFlo cell sorter (Dako) (Panel A) or fixed with 4% paraformaldehyde and stained with 7-AAD (Invitrogen; 40μm) for further flow cytometric analysis with MoFlo (Panel B) and ISS 100 (Amnis Corp.) (Panel C). Panel A shows flow cytometric analysis of cells without 7-AAD. Cells are presented on cytogram of FSC vs. SSC characteristics. Region R1 encloses all objects larger than 2μm in size that have been estimated when compared with size-predefined beads (Flow Cytometry Size beads, Invitrogen; Molecular Probes). Cells from Region R1 were further analyzed for CD45 and hematopoietic Lin expression. Lin-/CD45- cells included in Region R2 are visualized based on their SSC characteristics and Sca-1 expression. Region R3 includes cells that are Sca-1+/Lin-/CD45-. Panel B shows the cytogram of FSC characteristics of fixed cells and their staining for 7-AAD. Only events exhibiting DNA content are included in Region R1. 7-AAD+ events are visualized based on their CD45 vs. Lin expression and Lin-/CD45- objects are included in Region R2. Cells from Region R2 are analyzed based on their SSC characteristics as well as their Sca-1 expression. Region R3 encloses Sca-1+/Lin-/CD45- cells. Panel C presents ISS analysis of fixed cells in the presence of 7-AAD. The first plot shows objects according to their morphological parameters including the area of the nucleus and the aspect ratio of brightfield. The aspect ratio is calculated based on brightfield as the ratio of cellular minor axis (width) to major axis (height). Round, non-elongated cells have an aspect ratio close to 1.0, while the elongated cells or clumps had a lower aspect ratio. We included round, single cells containing DNA for further analysis (Region R1). Objects from Region R1 are visualized based on the expression of CD45 and Lin (middle histograms). Lin-/CD45- objects from Regions R2 and R3 are visualized on the dot-plot presenting their side scatter characteristics and Sca-1 expression. Sca-1+/Lin-/CD45- cells are included in Region R4. Percentages on all panels represent the content of Sca-1+/Lin-/CD45- cells among total cells derived from the thymus that were estimated with both methods (Mean± SEM).
Figure 2. Percent content of Sca-1+/Lin-/CD45- cells in murine organs by flow cytometry and ISS
Cells isolated from organs of adult (4-8 week old) C57BL/6 mice were stained against CD45, Lin, and Sca-1. Cells were analyzed by MoFlo flow cytometer and ISS as described in Figure 1. Gray bars represent the percent content of Sca-1+/Lin-/CD45- cells estimated by flow cytometry without 7-AAD, while hatched bars and black bars show the results obtained by flow cytometry and ISS with 7-AAD, respectively (Panels A-C). Results are presented as Mean ± SEM. Statistically significant differences (P<0.05) are shown when compared to: (*) results by flow cytometry without 7-AAD and (#) results by ISS obtained for each organ. Analysis was performed three times (N=3) with samples prepared from three independent organs for each analysis.
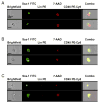
Figure 3. Artifacts detected with ISS
Selected images of falsely “positive” artifacts (Panel A), damaged/ degradating cells (Panel B), and cellular debris (Panel C) are shown. Each photograph presents brightfield image, separate fluorescent images related to nuclear image (7-AAD; red), and expression of Sca-1 (FITC, green), Lin (PE; orange), and CD45 (PE-Cy5; yellow) as well as a composite image combining brightfield, 7-AAD, and Sca-1 images. The scale bar indicates 10μm.
Figure 4. Percent content of Oct-4+/Sca-1+/Lin-/CD45- cells in murine organs by ISS
Cells isolated from organs of adult (4-8 week old) C57BL/6 mice were stained for Oct-4, CD45, Lin, and Sca-1. Cells were analyzed by ISS to detect intranuclear expression of Oct-4. Black bars show the percent content of Oct-4+ VSELs among total cells isolated from each organ, while gray bars show the content of these cells in the fraction of Sca-1+/Lin-/CD45- cells. Results are presented as Mean ± SD. Analysis was performed three times (N=3) with samples prepared from three independent organs for each analysis.
Figure 5. Absolute numbers of Oct-4+/Sca-1+/Lin-/CD45- cells present in murine organs
The content of Oct-4+ VSELs calculated per organ [×103] by employing percent content obtained by ISS and total numbers of cells isolated from each organ are shown. Values are presented as Mean ± SEM. The percentages are related to the total number of Oct-4+ cells per mouse and computed as the sum of these cells detected in all analyzed organs. Analysis was performed three times (N=3) with samples prepared from three independent organs for each analysis.
Figure 6. Representative images of Oct-4+/Sca-1+/Lin-/CD45- cells detected in murine organs by ISS
Cells isolated from organs were stained for pluripotent marker, Oct-4 (FITC; green), CD45 and Lin (PE; orange), and Sca-1 (PE-Cy5; magenta). Cells were stained with 7-AAD (red) to visualize nuclei and analyzed by ISS to detect intranuclear expression of Oct-4 as shown in magnified, combined images. The scale bars indicate 10μm.
Figure 7. Morphology of Oct-4+/Sca-1+/Lin-/CD45- cells present in murine organs by ISS
Cells isolated from organs were stained for pluripotent marker Oct-4, CD45, Lin, and Sca-1. Oct-4+ VSELs were identified by ISS as Sca-1+/Lin-/CD45- cells with intranuclear expression of Oct-4. Morphological features of cells such as size and N/C ratio were calculated using images of cells by IDEAS software. Size (black bars) was calculated based on brightfield images of cells as a length of the minor cellular axis expressed in micrometers, while N/C ratio (gray bars) was computed based on brightfield cellular images and nuclear images as a ratio between the area of the cytoplasm and the area of the nucleus. Results are presented as Mean ± SD. Analysis was performed three times (N=3) with samples prepared from three independent organs for each analysis.
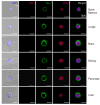
Figure 8. Confocal microscopic images of Oct-4+ VSELs detected in adult organs
Sorted Sca-1+/Lin-/CD45- cells were stained for Oct-4 (TRITC; red), CD45 (Cy5; magenta), and Sca-1 (FITC; green). Nuclei were stained with DAPI (blue). Representative images show Oct-4+/Sca-1+/Lin-/CD45- cells (VSELs) that are negative for CD45 and positive for Oct-4, which is a marker of pluripotent cells and Sca-1. Merged images show intranuclear staining for Oct-4 and surface appearance of Sca-1 antigen. The scale bars indicate 5μm.
Figure 9. Expression of mRNA for Oct-4 in cells isolated from murine organs
Panel A shows the expression of mRNA for Oct-4 and β2-microglobulin in sorted Sca-1+/Lin-/CD45- cells derived from each organ and investigated by RT-PCR. Panel B presents the expression of Oct-4 by real time RT-PCR in the sorted fractions. The graph shows the fold difference in the concentration of mRNA for Oct-4 between the organs when compared to the lowest expression detected in liver (not shown; recalculated as 1). Results are presented as Mean ± SEM. Statistically significant differences (*; P<0.05) are shown when compared to liver. Analysis was performed three times (N=3) with samples prepared from three independent organs for each analysis.
Comment in
- Shining cats and the tiny stem cells.
Tárnok A. Tárnok A. Cytometry A. 2008 Dec;73A(12):1107-8. doi: 10.1002/cyto.a.20678. Cytometry A. 2008. PMID: 19009611 No abstract available.
Similar articles
- Morphological and molecular characterization of novel population of CXCR4+ SSEA-4+ Oct-4+ very small embryonic-like cells purified from human cord blood: preliminary report.
Kucia M, Halasa M, Wysoczynski M, Baskiewicz-Masiuk M, Moldenhawer S, Zuba-Surma E, Czajka R, Wojakowski W, Machalinski B, Ratajczak MZ. Kucia M, et al. Leukemia. 2007 Feb;21(2):297-303. doi: 10.1038/sj.leu.2404470. Epub 2006 Nov 30. Leukemia. 2007. PMID: 17136117 - Cardiomyocyte differentiation of bone marrow-derived Oct-4+CXCR4+SSEA-1+ very small embryonic-like stem cells.
Wojakowski W, Tendera M, Kucia M, Zuba-Surma E, Milewski K, Wallace-Bradley D, Kazmierski M, Buszman P, Hrycek E, Cybulski W, Kaluza G, Wieczorek P, Ratajczak J, Ratajczak MZ. Wojakowski W, et al. Int J Oncol. 2010 Aug;37(2):237-47. doi: 10.3892/ijo_00000671. Int J Oncol. 2010. PMID: 20596650 - A multi-instrumental approach to identify and purify very small embryonic like stem cells (VSELs) from adult tissues.
Ratajczak MZ, Kucia M, Ratajczak J, Zuba-Surma EK. Ratajczak MZ, et al. Micron. 2009 Apr;40(3):386-93. doi: 10.1016/j.micron.2008.09.009. Epub 2008 Oct 19. Micron. 2009. PMID: 19028104 - Bone marrow-derived very small embryonic-like stem cells: their developmental origin and biological significance.
Kucia M, Wu W, Ratajczak MZ. Kucia M, et al. Dev Dyn. 2007 Dec;236(12):3309-20. doi: 10.1002/dvdy.21180. Dev Dyn. 2007. PMID: 17497671 Review. - Very small embryonic-like (VSEL) stem cells: purification from adult organs, characterization, and biological significance.
Ratajczak MZ, Zuba-Surma EK, Machalinski B, Ratajczak J, Kucia M. Ratajczak MZ, et al. Stem Cell Rev. 2008 Summer;4(2):89-99. doi: 10.1007/s12015-008-9018-0. Epub 2008 May 6. Stem Cell Rev. 2008. PMID: 18459073 Review.
Cited by
- Mouse Ovarian Very Small Embryonic-Like Stem Cells Resist Chemotherapy and Retain Ability to Initiate Oocyte-Specific Differentiation.
Sriraman K, Bhartiya D, Anand S, Bhutda S. Sriraman K, et al. Reprod Sci. 2015 Jul;22(7):884-903. doi: 10.1177/1933719115576727. Epub 2015 Mar 16. Reprod Sci. 2015. PMID: 25779995 Free PMC article. - Very small embryonic-like stem cells: biology and therapeutic potential for heart repair.
Zuba-Surma EK, Wojakowski W, Ratajczak MZ, Dawn B. Zuba-Surma EK, et al. Antioxid Redox Signal. 2011 Oct 1;15(7):1821-34. doi: 10.1089/ars.2010.3817. Epub 2011 May 5. Antioxid Redox Signal. 2011. PMID: 21194389 Free PMC article. Review. - Emerging concepts in non-invasive monitoring of Crohn's disease.
Marlicz W, Skonieczna-Żydecka K, Dabos KJ, Łoniewski I, Koulaouzidis A. Marlicz W, et al. Therap Adv Gastroenterol. 2018 Apr 18;11:1756284818769076. doi: 10.1177/1756284818769076. eCollection 2018. Therap Adv Gastroenterol. 2018. PMID: 29707039 Free PMC article. Review. - Murine bone marrow Lin⁻Sca⁻1⁺CD45⁻ very small embryonic-like (VSEL) cells are heterogeneous population lacking Oct-4A expression.
Szade K, Bukowska-Strakova K, Nowak WN, Szade A, Kachamakova-Trojanowska N, Zukowska M, Jozkowicz A, Dulak J. Szade K, et al. PLoS One. 2013 May 17;8(5):e63329. doi: 10.1371/journal.pone.0063329. Print 2013. PLoS One. 2013. PMID: 23696815 Free PMC article. - Evidence of Stem Cells Mobilization in the Blood of Patients with Pancreatitis: A Potential Link with Disease Severity.
Dąbkowski K, Łabędź-Masłowska A, Dołęgowska B, Safranow K, Budkowska M, Zuba-Surma E, Starzyńska T. Dąbkowski K, et al. Stem Cells Int. 2022 Jul 8;2022:5395248. doi: 10.1155/2022/5395248. eCollection 2022. Stem Cells Int. 2022. PMID: 35846982 Free PMC article.
References
- Kucia M, Reca R, Jala VR, Dawn B, Ratajczak J, Ratajczak MZ. Bone marrow as a home of heterogenous populations of nonhematopoietic stem cells. Leukemia. 2005;19:1118–1127. - PubMed
- Ratajczak MZ, Kucia M, Reca R, Majka M, Janowska-Wieczorek A, Ratajczak J. Stem cell plasticity revisited: CXCR4-positive cells expressing mRNA for early muscle, liver and neural cells ’hide out’ in the bone marrow. Leukemia. 2004;18:29–40. - PubMed
- Asahara T, Murohara T, Sullivan A, Silver M, van der Zee R, Li T, Witzenbichler B, Schatteman G, Isner JM. Isolation of putative progenitor endothelial cells for angiogenesis. Science. 1997;275:964–967. - PubMed
- Shi Q, Rafii S, Wu MH, Wijelath ES, Yu C, Ishida A, Fujita Y, Kothari S, Mohle R, Sauvage LR, Moore MA, Storb RF, Hammond WP. Evidence for circulating bone marrow-derived endothelial cells. Blood. 1998;92:362–367. - PubMed
- Peister A, Mellad JA, Larson BL, Hall BM, Gibson LF, Prockop DJ. Adult stem cells from bone marrow (MSCs) isolated from different strains of inbred mice vary in surface epitopes, rates of proliferation, and differentiation potential. Blood. 2004;103:1662–1668. - PubMed
Publication types
MeSH terms
Substances
LinkOut - more resources
Full Text Sources
Other Literature Sources
Research Materials
Miscellaneous


