Skeletal muscle-specific deletion of lipoprotein lipase enhances insulin signaling in skeletal muscle but causes insulin resistance in liver and other tissues - PubMed (original) (raw)
doi: 10.2337/db07-1839. Epub 2008 Oct 24.
Leslie A Knaub, Dalan R Jensen, Dae Young Jung, Eun-Gyoung Hong, Hwi-Jin Ko, Alison M Coates, Ira J Goldberg, Becky A de la Houssaye, Rachel C Janssen, Carrie E McCurdy, Shaikh M Rahman, Cheol Soo Choi, Gerald I Shulman, Jason K Kim, Jacob E Friedman, Robert H Eckel
Affiliations
- PMID: 18952837
- PMCID: PMC2606858
- DOI: 10.2337/db07-1839
Skeletal muscle-specific deletion of lipoprotein lipase enhances insulin signaling in skeletal muscle but causes insulin resistance in liver and other tissues
Hong Wang et al. Diabetes. 2009 Jan.
Erratum in
- Diabetes. 2010 Mar;59(3):756
Abstract
Objective: Skeletal muscle-specific LPL knockout mouse (SMLPL(-/-)) were created to study the systemic impact of reduced lipoprotein lipid delivery in skeletal muscle on insulin sensitivity, body weight, and composition.
Research design and methods: Tissue-specific insulin sensitivity was assessed using a hyperinsulinemic-euglycemic clamp and 2-deoxyglucose uptake. Gene expression and insulin-signaling molecules were compared in skeletal muscle and liver of SMLPL(-/-) and control mice.
Results: Nine-week-old SMLPL(-/-) mice showed no differences in body weight, fat mass, or whole-body insulin sensitivity, but older SMLPL(-/-) mice had greater weight gain and whole-body insulin resistance. High-fat diet feeding accelerated the development of obesity. In young SMLPL(-/-) mice, insulin-stimulated glucose uptake was increased 58% in the skeletal muscle, but was reduced in white adipose tissue (WAT) and heart. Insulin action was also diminished in liver: 40% suppression of hepatic glucose production in SMLPL(-/-) vs. 90% in control mice. Skeletal muscle triglyceride was 38% lower, and insulin-stimulated phosphorylated Akt (Ser473) was twofold greater in SMLPL(-/-) mice without changes in IRS-1 tyrosine phosphorylation and phosphatidylinositol 3-kinase activity. Hepatic triglyceride and liver X receptor, carbohydrate response element-binding protein, and PEPCK mRNAs were unaffected in SMLPL(-/-) mice, but peroxisome proliferator-activated receptor (PPAR)-gamma coactivator-1alpha and interleukin-1beta mRNAs were higher, and stearoyl-coenzyme A desaturase-1 and PPARgamma mRNAs were reduced.
Conclusions: LPL deletion in skeletal muscle reduces lipid storage and increases insulin signaling in skeletal muscle without changes in body composition. Moreover, lack of LPL in skeletal muscle results in insulin resistance in other key metabolic tissues and ultimately leads to obesity and systemic insulin resistance.
Figures
FIG. 1.
A: mRNA expression of LPL in muscle tissues. LPL mRNA expression was measured in red skeletal muscle (SM-Red), white skeletal muscle (SM-White), and heart using RT-PCR. n = 3 for both SMLPL−/− and control mice. B: Tissue-specific LPL activities in young SMLPL−/− mice. Heparin-releasable LPL activities were measured for skeletal red muscle (SM-Red), skeletal white muscle (SM-White), WAT, and heart from both the 9- to 11-week-old SMLPL−/− and control mice. LPL activities were expressed as nanomoles of FFA per minute per gram of tissue. n = 8 for SMLPL−/− and n = 10 for control mice. C: Weight, lean mass, and fat mass comparisons between young and old SMLPL−/− mice. The body weights of young (8–9 weeks) and old (8–10 months) SMLPL−/− mice were compared. Body compositions were determined by dual-energy X-ray absorptiometry. n = 5 for both SMLPL−/− and control mice at different ages. D: Weight gain in HF-fed SMLPL−/− mice. The body weights of 6-week-old SMLPL−/− and control mice that are subjected to either HF or LF diet were monitored every 2 weeks for 6 weeks. n = 6 for each group of mice.
FIG. 2.
Glucose tolerance test and insulin tolerance test of SMLPL−/− mice. Time courses of blood glucose levels in young SMLPL−/− and control mice after intraperitoneal injection of 1 g/kg glucose (A) or 0.75 units/kg insulin (B) are shown. Time courses are also shown of blood glucose levels in 6-month-old SMLPL−/− and control mice after intraperitoneal injection of 1 g/kg glucose (C) and for 12-week-old SMLPL−/− and control mice that have been subjected to different diet for 6 weeks (D). n = 6 for the glucose tolerance test, and n = 5 for SMLPL−/−; n = 4 for control mice in the insulin tolerance test.
FIG. 3.
Whole-body insulin sensitivity and tissue-specific glucose uptake in vivo in the SMLPL−/− and control mice. A: Steady-state whole-body glucose infusion rate during hyperinsulinemic-euglycemic clamps and hepatic insulin action as the percent suppression of basal hepatic glucose production during the clamps for young SMLPL−/− mice. n = 5 for both SMLPL−/− and control mice. B: Steady-state whole-body glucose infusion rate during hyperinsulinemic-euglycemic clamps for old SMLPL−/− mice. n = 5 for both SMLPL−/− and control mice. C: Tissue-specific glucose uptake. Insulin-stimulated glucose uptake in skeletal muscle (gastrocnemius, SM), WAT, brown adipose tissue (BAT), and heart were measured by injecting a bolus of 2-[14C]-DG during the clamp. n = 5 for SMLPL−/− and n = 6 for control mice. D: Insulin-stimulated glucose transport in soleus muscle of SMLPL−/− mice (n = 3 for both SMLPL−/− and control mice). DPM, disintegrations per minute.
FIG. 4.
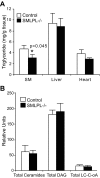
Intracellular TG and lipid metabolite concentrations in skeletal muscle, liver, and heart. A: Intracellular TG concentrations in skeletal muscle, liver, and heart. n = 8 for SMLPL−/− and n = 10 for control mice for skeletal muscle, n = 4 for liver, and n = 6 for heart. B: Intracelluar LC acyl-CoA, DAG, and ceramides levels in skeletal muscle. n = 8 for both groups of mice.
FIG. 5.
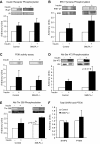
Insulin signaling in red skeletal muscle of the SMLPL−/− mice. Tryrosine phosphorylation levels of insulin receptor (A) and IRS-1 (B), PI 3-kinase activity (C), Ser473 phosphorylation level of Akt (D), and Thr308 phosphorylation level of Akt (E) were compared for the red skeletal muscle of both SMLPL−/− and control mice before and after insulin stimulation. Total SHIP2 and PTEN (F) were compared for the red skeletal muscle of both SMLPL−/− and control mice at basal condition. For A, B, D, and F, n = 4 for control mice and n = 5 for SMLPL−/− mice. For C and E, n = 3 for control and SMLPL−/− mice.
FIG. 6.
Gene expression profiling in the skeletal muscle and liver of SMLPL mice. Expression levels of seven representative genes in red skeletal muscle were assessed by RT-PCR for both SMLPL−/− and control mice (A). n = 5 for both groups of mice. Expression levels of 13 representative genes in liver (B) of both the SMLPL−/− and control mice were assessed by RT-PCR. n = 6 for SMLPL−/− and n = 7 for control mice.
Comment in
- Fat partitioning and insulin sensitivity: robbing Peter to pay Paul?
Watt MJ, Kraegen EW. Watt MJ, et al. Diabetes. 2009 Jan;58(1):16-7. doi: 10.2337/db08-1466. Diabetes. 2009. PMID: 19114724 Free PMC article. No abstract available.
Similar articles
- Insulin resistance caused by lipotoxicity is related to oxidative stress and endoplasmic reticulum stress in LPL gene knockout heterozygous mice.
Li YX, Han TT, Liu Y, Zheng S, Zhang Y, Liu W, Hu YM. Li YX, et al. Atherosclerosis. 2015 Mar;239(1):276-82. doi: 10.1016/j.atherosclerosis.2015.01.020. Epub 2015 Jan 23. Atherosclerosis. 2015. PMID: 25635326 - Tissue-specific overexpression of lipoprotein lipase causes tissue-specific insulin resistance.
Kim JK, Fillmore JJ, Chen Y, Yu C, Moore IK, Pypaert M, Lutz EP, Kako Y, Velez-Carrasco W, Goldberg IJ, Breslow JL, Shulman GI. Kim JK, et al. Proc Natl Acad Sci U S A. 2001 Jun 19;98(13):7522-7. doi: 10.1073/pnas.121164498. Epub 2001 Jun 5. Proc Natl Acad Sci U S A. 2001. PMID: 11390966 Free PMC article. - Effect of dietary macronutrient composition on tissue-specific lipoprotein lipase activity and insulin action in normal-weight subjects.
Yost TJ, Jensen DR, Haugen BR, Eckel RH. Yost TJ, et al. Am J Clin Nutr. 1998 Aug;68(2):296-302. doi: 10.1093/ajcn/68.2.296. Am J Clin Nutr. 1998. PMID: 9701186 Clinical Trial. - Lipoprotein lipase: from gene to obesity.
Wang H, Eckel RH. Wang H, et al. Am J Physiol Endocrinol Metab. 2009 Aug;297(2):E271-88. doi: 10.1152/ajpendo.90920.2008. Epub 2009 Mar 24. Am J Physiol Endocrinol Metab. 2009. PMID: 19318514 Review. - Overexpression of muscle lipoprotein lipase and insulin sensitivity.
Pulawa LK, Eckel RH. Pulawa LK, et al. Curr Opin Clin Nutr Metab Care. 2002 Sep;5(5):569-74. doi: 10.1097/00075197-200209000-00017. Curr Opin Clin Nutr Metab Care. 2002. PMID: 12172482 Review.
Cited by
- Mechanisms underlying skeletal muscle insulin resistance induced by fatty acids: importance of the mitochondrial function.
Martins AR, Nachbar RT, Gorjao R, Vinolo MA, Festuccia WT, Lambertucci RH, Cury-Boaventura MF, Silveira LR, Curi R, Hirabara SM. Martins AR, et al. Lipids Health Dis. 2012 Feb 23;11:30. doi: 10.1186/1476-511X-11-30. Lipids Health Dis. 2012. PMID: 22360800 Free PMC article. Review. - Emerging strategies of targeting lipoprotein lipase for metabolic and cardiovascular diseases.
Geldenhuys WJ, Lin L, Darvesh AS, Sadana P. Geldenhuys WJ, et al. Drug Discov Today. 2017 Feb;22(2):352-365. doi: 10.1016/j.drudis.2016.10.007. Epub 2016 Oct 19. Drug Discov Today. 2017. PMID: 27771332 Free PMC article. Review. - Genetic polymorphisms of lipoprotein lipase gene and their associations with growth traits in Xiangxi cattle.
Wang XP, Luoreng ZM, Li F, Wang JR, Li N, Li SH. Wang XP, et al. Mol Biol Rep. 2012 Dec;39(12):10331-8. doi: 10.1007/s11033-012-1910-7. Epub 2012 Oct 9. Mol Biol Rep. 2012. PMID: 23053937 - Carcinoembryonic antigen-related cell adhesion molecule 2 controls energy balance and peripheral insulin action in mice.
Heinrich G, Ghosh S, Deangelis AM, Schroeder-Gloeckler JM, Patel PR, Castaneda TR, Jeffers S, Lee AD, Jung DY, Zhang Z, Opland DM, Myers MG Jr, Kim JK, Najjar SM. Heinrich G, et al. Gastroenterology. 2010 Aug;139(2):644-52, 652.e1. doi: 10.1053/j.gastro.2010.03.056. Epub 2010 Apr 8. Gastroenterology. 2010. PMID: 20381490 Free PMC article. - Skeletal muscle insulin resistance: the interplay of local lipid excess and mitochondrial dysfunction.
Chow L, From A, Seaquist E. Chow L, et al. Metabolism. 2010 Jan;59(1):70-85. doi: 10.1016/j.metabol.2009.07.009. Epub 2009 Sep 18. Metabolism. 2010. PMID: 19766267 Free PMC article. Review. No abstract available.
References
- Merkel M, Eckel RH, Goldberg IJ: Lipoprotein lipase: genetics, lipid uptake, and regulation. J Lipid Res 43: 1997–2006, 2002 - PubMed
- Eckel RH: Lipoprotein lipase: a multifunctional enzyme relevant to common metabolic diseases. N Engl J Med 320: 1060–1068, 1989 - PubMed
- Zechner R: The tissue-specific expression of lipoprotein lipase: implications for energy and lipoprotein metabolism. Curr Opin Lipidol 8: 77–88, 1997 - PubMed
- Goldberg IJ, Merkel M: Lipoprotein lipase: physiology, biochemistry, and molecular biology. Front Biosci 6: D388–D405, 2001 - PubMed
Publication types
MeSH terms
Substances
Grants and funding
- U24: DK-76169/DK/NIDDK NIH HHS/United States
- U24 DK076169/DK/NIDDK NIH HHS/United States
- P30 DK048520/DK/NIDDK NIH HHS/United States
- P30DK048520/DK/NIDDK NIH HHS/United States
- P30: DK-45735/DK/NIDDK NIH HHS/United States
- U24 DK059635/DK/NIDDK NIH HHS/United States
- R01 DK040936/DK/NIDDK NIH HHS/United States
- P30 DK045735/DK/NIDDK NIH HHS/United States
- DK-26356/DK/NIDDK NIH HHS/United States
- R01:DK-40936/DK/NIDDK NIH HHS/United States
- DK-059767/DK/NIDDK NIH HHS/United States
- R01 DK080756/DK/NIDDK NIH HHS/United States
LinkOut - more resources
Full Text Sources
Other Literature Sources
Medical
Molecular Biology Databases


