Chromatin immunoprecipitation on microarray analysis of Smad2/3 binding sites reveals roles of ETS1 and TFAP2A in transforming growth factor beta signaling - PubMed (original) (raw)
Chromatin immunoprecipitation on microarray analysis of Smad2/3 binding sites reveals roles of ETS1 and TFAP2A in transforming growth factor beta signaling
Daizo Koinuma et al. Mol Cell Biol. 2009 Jan.
Abstract
The Smad2 and Smad3 (Smad2/3) proteins are principally involved in the transmission of transforming growth factor beta (TGF-beta) signaling from the plasma membrane to the nucleus. Many transcription factors have been shown to cooperate with the Smad2/3 proteins in regulating the transcription of target genes, enabling appropriate gene expression by cells. Here we identified 1,787 Smad2/3 binding sites in the promoter regions of over 25,500 genes by chromatin immunoprecipitation on microarray in HaCaT keratinocytes. Binding elements for the v-ets erythroblastosis virus E26 oncogene homolog (ETS) and transcription factor AP-2 (TFAP2) were significantly enriched in Smad2/3 binding sites, and knockdown of either ETS1 or TFAP2A resulted in overall alteration of TGF-beta-induced transcription, suggesting general roles for ETS1 and TFAP2A in the transcription induced by TGF-beta-Smad pathways. We identified novel Smad binding sites in the CDKN1A gene where Smad2/3 binding was regulated by ETS1 and TFAP2A. Moreover, we showed that small interfering RNAs for ETS1 and TFAP2A affected TGF-beta-induced cytostasis. We also analyzed Smad2- or Smad3-specific target genes regulated by TGF-beta and found that their specificity did not appear to be solely determined by the amounts of the Smad2/3 proteins bound to the promoters. These findings reveal novel regulatory mechanisms of Smad2/3-induced transcription and provide an essential resource for understanding their roles.
Figures
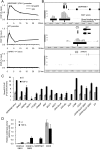
FIG. 1.
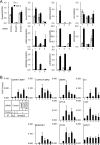
Identification of Smad2/3 binding sites in promoters of human genes with HaCaT cells. (A) Time course of Smad2/3 binding to known target promoters. HaCaT cells were treated with TGF-β, formalin fixed at the indicated times, and harvested. Chromatin precipitated by anti-Smad2/3 or control IgG was reverse-cross-linked, and the obtained genomic fragments were quantified by real-time PCR. Data were normalized by input DNA. IgG, mouse control IgG1. Error bars represent standard deviations. (B) Comparison of obtained ChIP-chip signals with published Smad binding positions at promoters of the known target genes of TGF-β. Obtained probe signals were transformed to MAT scores for each position, and peak signal positions were determined from the significant Smad binding regions in the SERPINE1 or ID1 promoter. The HPRT1 intronic region is shown as a control. The upper black bars represent significant Smad binding regions, and the lower bars indicate peak positions. The bold black arrows are reported Smad binding positions. The double-headed arrows are positions of amplicons analyzed in panel A. (C) Validation of Smad2/3 binding by ChIP-qPCR. HaCaT cells were treated as for panel A, and Smad2/3-bound DNA at 1.5 h after TGF-β treatment was quantified by real-time PCR. Values are presented as _n_-fold enrichment over the mean value of control Smad2/3 ChIPs (HPRT1, HOXA13, and KIF5B promoters). SBR1/2, Smad binding region 1/2 (see Fig. 5A). Error bars represent standard errors. (D) Validation of the TGF-β-induced transcriptional activity of identified Smad2/3 binding regions. HaCaT cells were transfected with the luciferase reporter constructs as indicated and stimulated with TGF-β. Error bars represent the standard errors.
FIG. 2.
The SBRs are enriched near transcription start sites and frequently found in upregulated genes. (A) Smad binding regions are evolutionarily conserved. The average conservation of Smad binding regions was determined by CEAS analysis tools (23) by using phastCons score (48) information for analysis. As a control, two sets of randomly selected promoter regions were analyzed and plotted as gray lines. (B) Smad binding regions are enriched near transcription start sites. The distribution of the peak positions of Smad binding regions relative to the nearby RefSeq gene was determined, and results were normalized by the distribution of probes designed for the array used. UTR, untranslated region. (C) Summary of expression array results compared to ChIP-chip analysis. A total of 9,669 genes that had values of more than 100 at at least one time point for one of their probes (n = 14,754) were used for the following analysis. Upregulated or downregulated genes were determined compared to 0 h values. The positions of peak signals of SBRs relative to the nearby RefSeq genes were first determined, and regions more than 5 kb upstream from the transcription start site and downstream from the first intron were filtered out. (D) Smad binding regions were enriched at upregulated genes. Probe signals were sorted by the change in expression at 6 (left) or 24 (right) h with TGF-β stimulation and compared to the presence of SBRs (black bars). Changes in expression were visualized by heat mapping.
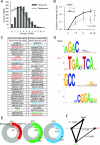
FIG. 3.
Enrichment of ETS and TFAP2 sites in SBRs. (A) Canonical Smad binding elements are enriched in SBRs. GTCT or AGAC SBEs were counted from repetitive-sequence-masked DNA sequences of 250 bp from the peak position of each SBR (Observed) and compared to the average result of five shuffled sequences (Background). Error bars represent the standard deviations. (B) Number of SBEs correlated with the magnitude of the TGF-β response. Changes in expression, compared to 0 h, of all of the target genes with SBRs were log2 transformed and subdivided by the number of SBEs (zero to one versus two or more). Mean values are shown. Error bars represent the standard deviations. Significance of difference by SBE number was determined by repeated-measures analysis of variance. (C) Identification of enriched transcription factor binding motifs in SBRs. DNA sequences of 100 or 250 bp from the peak position of each SBR were analyzed by CEAS, and the top 31 significantly enriched motifs are shown. There were many matrices defined for the same transcription factors, and AP-1, ETS, and AP-2 sites are categorized and colored red, green, and blue, respectively. The Smad binding element (M00792.SMAD) is shown in bold characters. As a control, we analyzed randomly selected promoter regions by CEAS and confirmed that enrichment of AP-1, ETS, and AP-2 sites was less significant than in Smad2/3 ChIP-chip results (data not shown). (D) Schematic representation of some of the enriched transcription factor binding motifs. Representative matrix data for each enriched transcription factor binding site are shown by Weblogo (8) and were obtained from the CEAS web tool. Sites in panel C: SMAD, M00792.SMAD; AP-1, M00199; AP-2, AP-2alpha; ETS, Elk-1. (E) Frequencies of AP-1, AP-2, and ETS sites in Smad2/3 binding regions. Frequencies of AP-1, AP-2, and ETS sites 250 bp from the peak position of SBRs were determined by a pattern-based identification approach (outer circles) and compared to their shuffled background sequences (inner circles). (F) Smad, ETS, and AP-2 sites appeared to be found in the same Smad binding regions. Pairwise analysis of each enriched motif was performed with Fisher's exact probability test, with significance presented as lines. Broader lines indicate greater significance.
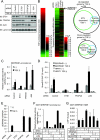
FIG. 4.
Knockdown of ETS1 and TFAP2A affects target gene expression. (A) Knockdown of ETS1, TFAP2A, or JUN protein in HaCaT cells. Cells were transfected with siRNAs as indicated, 48 h later treated with 3 ng/ml TGF-β for 3 h, and harvested. A 30-μg portion of the nuclear fraction of the cell lysate was applied. The upper three panels show ETS1, TFAP2A, and JUN protein levels, while the lower panel shows lamin A/C as a loading control. IB, immunoblot. (B) Summary of the effects of ETS1 and TFAP2A siRNAs on TGF-β-induced gene expression at 24 h after stimulation. HaCaT cells were transfected with siRNAs as indicated and 48 h later treated with 1 ng/ml TGF-β for 0 or 24 h, and then total RNAs were extracted. For the identified Smad2/3 target genes near the SBRs (Fig. 2C), probe signals were sorted by their TGF-β-induced change in expression in the cells transfected with control siRNA (24 h/0 h, left). The effects of the ETS1 and TFAP2A siRNAs on target gene expression at 24 h after TGF-β stimulation were determined, compared to a control siRNA, and are shown in the same order (right). Arrows indicate the positions where CDKN1A and SERPINE1 reside. For genes either upregulated or downregulated twofold by TGF-β, the effects of the ETS1 and TFAP2A siRNAs are shown as Venn diagrams. A plus sign indicates the number of genes whose TGF-β-induced expression change was inhibited twofold or more by the siRNAs. A minus sign indicates the number of genes whose TGF-β-induced expression change was enhanced twofold or more by the siRNAs. (C) Luciferase reporter activity induced by TGF-β in siRNA-transfected HaCaT cells. Cells were serially transfected with siRNAs and reporter constructs and left unstimulated or stimulated with TGF-β, and reporter activities were determined. Error bars represent the standard errors. (D) Effects of JUN, ETS1, and TFAP2A siRNAs on Smad2/3 ChIP. HaCaT cells were transfected with siRNAs as indicated, left unstimulated or treated 72 h later with 1 ng/ml TGF-β for 1.5 h, and harvested. Smad2/3 binding to the SERPINE1 promoter region or HPRT1 intron as a control was determined by ChIP-qPCR. Error bars represent the standard deviations. (E) Effects of JUN, ETS1, and TFAP2A siRNAs on SERPINE1 mRNA expression. HaCaT cells were transfected with the indicated siRNAs, left unstimulated or stimulated 30 h later with 1 ng/ml of TGF-β, and incubated for an additional 24 h. SERPINE1 expression was determined by RT-qPCR and normalized by GAPDH expression. Error bars represent the standard deviations. (F) Effects of forced expression of ETS1, TFAP2A, or JUN on SERPINE1 promoter-reporter activity in 293T cells. Cells were transfected with the indicated plasmids, and luciferase activities were determined 24 h later. ALK-5-TD: constitutively active type I TGF-β receptor. Error bars indicate the standard deviations. (G) Exogenous ETS1 enhances Smad2/3 binding to the SERPINE1 promoter in 293T cells. Cells were transfected with the indicated plasmid and 24 h later fixed and harvested. ChIP-qPCR was performed as described for panel D. Error bars represent the standard errors. Ig, control IgG.
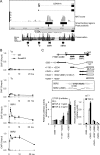
FIG. 5.
Novel Smad binding regions in the first intron of the CDKN1A gene. (A) Schematic representation of novel Smad binding regions in the CDKN1A gene. MAT scores, significant Smad2/3 binding regions, and peak positions are shown as in Fig. 1B. Interspecies conservation of genomic sequences was obtained from the University of California Santa Cruz genome browser and is shown in the lower panel. E1/E2, exons 1 and 2; a/b, positions of amplicon analyzed in panel B. (B) Validation of Smad2/3 binding to the CDKN1A intronic regions by ChIP-qPCR. HaCaT cells were treated as for Fig. 1A, and Smad2/3 ChIP samples were quantified by ChIP-qPCR, with each primer amplifying the position indicated in panel A. (C) Confirmation of TGF-β-induced transcriptional response in CDKN1A SBR1/2 by luciferase reporter assays. The upper panel shows a schematic representation of the reporter constructs used. The inset shows the identified SBE within SBR2 and its mutant used in the following experiment. (Lower left) HaCaT cells were transfected with the reporters indicated and treated with TGF-β or TGF-β type I receptor kinase inhibitor A44-03 (represented as TGF-β inhibitor, 1 μM), and luciferase activities were determined. (Lower right) HaCaT cells were transfected with the reporters indicated and treated with TGF-β, and luciferase activities were determined. MLP, minimal luciferase promoter; FHBE 4×SBE, reported forkhead transcription factor binding element and four tandem SBEs (45). Error bars represent the standard deviations.
FIG. 6.
ETS1, TFAP2A, and JUN affect TGF-β-induced CDKN1A expression and cytostasis. (A) Luciferase reporter activity induced by TGF-β in siRNA-transfected HaCaT cells. Cells were serially transfected with siRNA and reporter constructs and left unstimulated or stimulated with TGF-β, and reporter activities were determined. Error bars represent the standard errors. (B) Effects of JUN, ETS1, and TFAP2A siRNAs on Smad2/3 ChIP. HaCaT cells were transfected with siRNAs as indicated, left unstimulated or treated 72 h later with 1 ng/ml TGF-β for 1.5 h, and harvested. Smad2/3 binding to the indicated promoter regions was determined by ChIP-qPCR. Error bars represent the standard deviations. (C) Deletion of an ETS site in CDKN1A SBR2 results in loss of TGF-β-induced transcription. (Upper panel) Partial DNA sequence of CDKN1A SBR2 with identified SBE and ETS binding site. Numbers indicate relative positions from the transcription start site. (Lower panel) HaCaT cells were transfected with luciferase reporter constructs as indicated and stimulated with TGF-β. Transcriptional activity was then determined. ΔSBE, CDKN1A +3543 to +5387 reporter construct with deletion of SBE (+4180 to +4187); ΔETS, deletion construct of ETS binding site (+4211 to +4217). (D) Effects of JUN, ETS1, and TFAP2A siRNAs on CDKN1A mRNA expression. HaCaT cells were treated as for Fig. 4E, and CDKN1A expression was determined by RT-qPCR. Error bars represent the standard deviations. (E) Immunoblotting (IB) of CDKN1A protein in siRNA-transfected cells. HaCaT cells were transfected with the siRNAs indicated, treated with 3 ng/ml TGF-β for 3 h, and lysed. The top panel shows CDKN1A expression, and the bottom panel shows α-tubulin as a loading control. (F) Thymidine incorporation assay of siRNA-transfected HaCaT cells. Cells were transfected with siRNAs and 24 h later treated with TGF-β as indicated, and [3H]thymidine incorporation was determined. Values are _n_-fold changes relative to no TGF-β treatment. Error bars represent the standard deviations. (G) Knockdown of CDKN1A by siRNA. HaCaT cells were transfected with CDKN1A siRNA as for panel D, and CDKN1A expression was determined by RT-qPCR at the indicated time points after treatment with TGF-β (1 ng/ml). Error bars represent the standard deviations. (H) Thymidine incorporation assay of HaCaT cells transfected with the CDKN1A siRNA. Cells were treated as for panel F, and the effect of CDKN1A siRNA was determined. Error bars represent the standard deviations.
FIG. 7.
Effects of Smad2 and Smad3 siRNAs on TGF-β-induced gene expression and Smad2/3 binding to the promoters. (A) HaCaT cells were transfected with Smad2 or Smad3 siRNAs and 48 h later stimulated with 1 ng/ml TGF-β for 24 h. Levels of gene expression were determined by RT-qPCR and normalized by GAPDH. Each lane represents cells treated with control siRNA (lane 1), Smad2 siRNA (lane 2), or Smad3 siRNA (lane 3). Error bars represent the standard deviations. (B) HaCaT cells were transfected with siRNAs, 48 h later treated with TGF-β for 1.5 h, and fixed. ChIP-qPCR was performed as for Fig. 4D and normalized by input DNA. For double knockdown of Smad2 and Smad3, the total amounts of siRNA were adjusted to be the same as in the other samples. Each lane represents cells treated with control siRNA (lanes 1 to 3), Smad2 siRNA (lane 4), Smad3 siRNA (lane 5), or Smad2 and Smad3 siRNAs (lane 6). Samples were immunoprecipitated (IP) with control IgG (lane 1) or Smad2/3 antibody (lanes 2 to 6). Cells were not treated with TGF-β in lane 2. Error bars represent the standard deviations.
Similar articles
- Tenascin-C upregulation by transforming growth factor-beta in human dermal fibroblasts involves Smad3, Sp1, and Ets1.
Jinnin M, Ihn H, Asano Y, Yamane K, Trojanowska M, Tamaki K. Jinnin M, et al. Oncogene. 2004 Mar 4;23(9):1656-67. doi: 10.1038/sj.onc.1207064. Oncogene. 2004. PMID: 15001984 - Smad3/AP-1 interactions control transcriptional responses to TGF-beta in a promoter-specific manner.
Verrecchia F, Vindevoghel L, Lechleider RJ, Uitto J, Roberts AB, Mauviel A. Verrecchia F, et al. Oncogene. 2001 Jun 7;20(26):3332-40. doi: 10.1038/sj.onc.1204448. Oncogene. 2001. PMID: 11423983 - A tale of two proteins: differential roles and regulation of Smad2 and Smad3 in TGF-beta signaling.
Brown KA, Pietenpol JA, Moses HL. Brown KA, et al. J Cell Biochem. 2007 May 1;101(1):9-33. doi: 10.1002/jcb.21255. J Cell Biochem. 2007. PMID: 17340614 Review. - TGF-beta and cancer: is Smad3 a repressor of hTERT gene?
Li H, Xu D, Toh BH, Liu JP. Li H, et al. Cell Res. 2006 Feb;16(2):169-73. doi: 10.1038/sj.cr.7310023. Cell Res. 2006. PMID: 16474430 Review.
Cited by
- Transcriptional profiling identifies functional interactions of TGF β and PPAR β/δ signaling: synergistic induction of ANGPTL4 transcription.
Kaddatz K, Adhikary T, Finkernagel F, Meissner W, Müller-Brüsselbach S, Müller R. Kaddatz K, et al. J Biol Chem. 2010 Sep 17;285(38):29469-79. doi: 10.1074/jbc.M110.142018. Epub 2010 Jul 1. J Biol Chem. 2010. PMID: 20595396 Free PMC article. - Global identification of SMAD2 target genes reveals a role for multiple co-regulatory factors in zebrafish early gastrulas.
Liu Z, Lin X, Cai Z, Zhang Z, Han C, Jia S, Meng A, Wang Q. Liu Z, et al. J Biol Chem. 2011 Aug 12;286(32):28520-32. doi: 10.1074/jbc.M111.236307. Epub 2011 Jun 13. J Biol Chem. 2011. PMID: 21669877 Free PMC article. - Cell-penetrating TLR inhibitor peptide alleviates ulcerative colitis by the functional modulation of macrophages.
Thapa B, Pak S, Chung D, Shin HK, Lee SH, Lee K. Thapa B, et al. Front Immunol. 2023 May 5;14:1165667. doi: 10.3389/fimmu.2023.1165667. eCollection 2023. Front Immunol. 2023. PMID: 37215126 Free PMC article. - Regulatory T Cell Mimicry by a Subset of Mesenchymal GBM Stem Cells Suppresses CD4 and CD8 Cells.
Johnson AL, Khela HS, Korleski J, Sall S, Li Y, Zhou W, Smith-Connor K, Laterra J, Lopez-Bertoni H. Johnson AL, et al. Cells. 2025 Apr 14;14(8):592. doi: 10.3390/cells14080592. Cells. 2025. PMID: 40277917 Free PMC article. - TGF-β-induced cell motility requires downregulation of ARHGAPs to sustain Rac1 activity.
Motizuki M, Koinuma D, Yokoyama T, Itoh Y, Omata C, Miyazono K, Saitoh M, Miyazawa K. Motizuki M, et al. J Biol Chem. 2021 Jan-Jun;296:100545. doi: 10.1016/j.jbc.2021.100545. Epub 2021 Mar 17. J Biol Chem. 2021. PMID: 33741342 Free PMC article.
References
- Carroll, J. S., C. A. Meyer, J. Song, W. Li, T. R. Geistlinger, J. Eeckhoute, A. S. Brodsky, E. K. Keeton, K. C. Fertuck, G. F. Hall, Q. Wang, S. Bekiranov, V. Sementchenko, E. A. Fox, P. A. Silver, T. R. Gingeras, X. S. Liu, and M. Brown. 2006. Genome-wide analysis of estrogen receptor binding sites. Nat. Genet. 381289-1297. - PubMed
- Chen, C. R., Y. Kang, P. M. Siegel, and J. Massague. 2002. E2F4/5 and p107 as Smad cofactors linking the TGF-β receptor to c-myc repression. Cell 11019-32. - PubMed
Publication types
MeSH terms
Substances
LinkOut - more resources
Full Text Sources
Other Literature Sources
Molecular Biology Databases
Research Materials
Miscellaneous
