Interaction between Reelin and Notch signaling regulates neuronal migration in the cerebral cortex - PubMed (original) (raw)
Interaction between Reelin and Notch signaling regulates neuronal migration in the cerebral cortex
Kazue Hashimoto-Torii et al. Neuron. 2008.
Abstract
Neuronal migration is a fundamental component of brain development whose failure is associated with various neurological and psychiatric disorders. Reelin is essential for the stereotypical inside-out sequential lamination of the neocortex, but the molecular mechanisms of its action still remain unclear. Here we show that regulation of Notch activity plays an important part in Reelin-signal-dependent neuronal migration. We found that Reelin-deficient mice have reduced levels of the cleaved form of Notch intracellular domain (Notch ICD) and that loss of Notch signaling in migrating neurons results in migration and morphology defects. Further, overexpression of Notch ICD mitigates the laminar and morphological abnormalities of migrating neurons in Reeler. Finally, our in vitro biochemical studies show that Reelin signaling inhibits Notch ICD degradation via Dab1. Together, our results indicate that neuronal migration in the developing cerebral cortex requires a Reelin-Notch interaction.
Figures
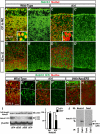
Figure 1. Nuclear Notch ICD is reduced in cortical neurons in Reeler
(A-H) Nuclei (red) and Notch1 (green in A-D’, antigen is Notch1 intracellular domain) and Notch1 ICD cleaved form (green in E-H) immunostaining in the cortex of wild-type and mutants as indicated. Higher magnifications are shown in the insets. Dashed lines in (E-G) indicate the pial surface and the border between CP and MZ in wild-type or superplate (SPP) in the mutants. (G) and (H) show upper CP and lower CP/IZ, respectively (the asterisk indicate the same cell). Note that Notch1 ICD expression at the lower CP (inverted layer II/III) is significantly decreased in Vldlr/ApoER2 mutant (H) which is similar to Reeler (not shown). Green staining at the pial surface in (G) is nonspecific. Bars = 25 μm. (I) Immunoblots of full-length Notch1 (p300), Notch1 ICD and β-actin from the same cortical lysates of 2 rl/+ and 2 rl/rl. Notch1 ICD bands include p110 non-phosphorylated and p120 phosphorylated forms. Right panel: Relative values of the band intensity of indicated proteins from rl/rl against those from rl/+, which were set as 100. Band intensities for each mutant were normalized to β-actin. The data represent the mean ± SD of 5 brains from independent experiments. *p<0.01 by paired t-test. (J) Immunoprecipitation (IP) of brain lysates with a non-specific goat IgG as negative control (left) or Dab1-specific antibody (E-19; right) followed by Notch1 and Dab1 immunoblotting (IB).
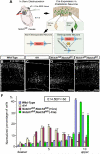
Figure 2. Notch signaling is required for proper radial migration of cortical neurons
(A) Schematic representation of Notch genomic deletion in the migrating neurons. (B-E) Venus immunostaining 6 days post-electroporation with pTα1-Cre-IRES-Venus (B-D) or pTα1-IRES-Venus (E) into indicated mice. Bar (μm) = 100. Dashed lines indicate pial and ventricular surfaces. (F) The graphs indicate quantification of the distribution of Venus+ neurons in the 10 bins dividing the whole thickness of the cortex as indicated in B in each genotype. The data represent the mean ± SEM of 4 brains each from independent experiments. p<0.0001, p<0.0001_, and _p>0.05 for rl/rl, Notch1fl/fl;Notch2fl/fl(+Cre) and Notch1fl/fl;Notch2fl/fl(−Cre), respectively compared with wild-type by Two-sample Kolmogorov-Smirnov test (K-S test). F(9,54)=107.40, p<0.0001_, F(9,45)=54.92, _p<0.0001_, and F(9,54)=0.78, _p>0.05, respectively by Repeated Measures ANOVA.
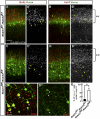
Figure 3. Notch deletion causes laminar displacement of later-born neurons
(A-D”) Venus (green) immunostaining with BrdU or Cutl1 (red or white) staining in indicated mutants at P14. Note that Cutl1 analysis was performed in the dorsal somatosensory region where endogenous Cutl1 expression in lower layers is normally absent. BrdU+/Venus+ or Cutl1+/Venus+ neurons in the Notch deleted cortex (C-D’, arrows) are abnormally positioned in lower layers than in the control cortex (A-B’, arrows). (C”, D”) Higher magnification views of BrdU+/Venus+ and Cutl1+/Venus+ double-labeled neurons around layer V, respectively (arrows). Bars (μm) = 100 (A-D”), 10 (C”, D”’). (E) Quantification of the distribution of Venus+ neurons under Layer IV in the Notch1 fl/+; Notch2 fl/+ and Notch1 fl/fl; Notch2 fl/fl cortex. The data represent the mean ± SEM of 4 brains each from independent experiments. * p<0.005, Student’s t-test.
Figure 4. Morphological defects in migrating neurons after loss of Notch signaling
(A-C) Venus immunostaining revealed migrating neuronal morphology 3 days post-electroporation with pTα1-Cre-IRES-Venus in wild-type, Reeler and Notch1 fl/fl; Notch2 fl/fl mice. Red arrows in (C) indicate ectopic primary processes. (A’-C’) 3D reconstruction of Venus+ migrating neurons in mice of each genotype 3 days post-electroporation. (D) Percentage of primary processes (directly protruded from cells) oriented normally (The ‘oriented normally’ primary processes were defined according to their angle towards the pial surface within ±15°) and abnormally. * _p<0.01_, **_p<0.001_, Student’s t-test comparing with wt. (E) Percentage of cells with one (black), two (blue) or >3 (white) processes per cell. * p<0.05, **p<0.01, Student’s t-test comparing corresponding bins to wt. (F) Box plots of the average primary process length per cell (total process length/number of the primary processes). *p<0.05, **p<0.01, Mann-Whitney’s U test. A total of 120 cells/genotype from four brains (different litters) were analyzed for orientation (D) and number of processes (E). The box plots of primary process length (F) were obtained for each genotype (n=30 each from 3 brains {different litters}). Bars (μm) = 10.
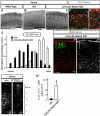
Figure 5. Replenishing of Notch ICD mitigates neuronal migration defects in Reeler
(A-D) Immunostaining for Venus (black, green) and Tbr1 (red) in cortical slices of indicated genotypes 4 days (A-C’) or 4.5 days (D) post-electroporation (with pTα1-Cre-IRES-Venus). (D) Higher magnification view around the SPP. Dashed lines in (C’) and (D) indicate the pial surface and the border between the SPP and CP, respectively. Bracket in (C’) shows the SPP region. Note that electroporated Venus+ cells did not change their fate to Tbr1+ early-born neurons (C’, D). (E) Quantification of neuronal distribution showed significantly more cells in upper CP of rl/rl;LSL-Notch ICD compared to rl/rl cortex (K-S test, p<0.0001; Repeated Measures ANOVA, F(9,54)=18.91, p<0.0001). The data represent the mean ± SEM of 6 brains each. (F, F’) Immunostaining for Venus (green) and BrdU (red, white) in P3 cortical slices of rl/rl;LSL-Notch ICD electroporated with pTα1-Cre-IRES-Venus. Note that Venus+/BrdU+ cells (indicated by bracket) located over BrdU+ cells in surrounding lower layers. (G, G’) Venus immunostaining in P3 cortical slices of rl/rl and rl/rl;LSL-Notch ICD electroporated with pTα1-Cre-IRES-Venus. (G”) Quantification of Venus+ neurons located in the upper part of the CP (within the bin 5 indicated by a red bracket in G, G’. Entire thickness of the cortex was subdivided into 5 bins.) The data represent the mean ± SEM of 3 brains each. *p<0.05, Student’s t-test. Bars (μm) = 100 (A-C’, F-G’), 20 (D).
Figure 6. Replenishing of Notch ICD mitigates morphological defects in Reeler
(A) Venus+ neurons 3 days post-electroporation with pTα1-Cre-IRES-Venus in rl/rl;LSL-Notch ICD mice. Left neuron in (A) showed rescued morphology with processes that were more pial-oriented compared to rl/rl (e.g. Fig. 4B). (A’) 3D reconstruction of Venus+ neurons (compare with rl/rl in Fig.4B’). (B-D) Quantification of direction of primary processes (B), primary process number per cell (C) and average primary process length per cell (D) for the electroporated neurons in mice of indicated genotypes. *p<0.05, Student’s t-test (B, C), *p<0.05, Mann-Whitney’s U test (D). A total of 120 cells/genotype from four independent experiments were analyzed for orientation (B) and number of processes (C). The box plots of primary process length (D) were obtained for each genotype (n=30 each from 3 independent experimental sets). For better comparison with Reeler, duplicated data from Figure 4 were included. Bar (μm) = 10.
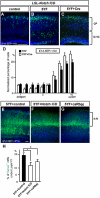
Figure 7. Notch ICD mitigates radial migration defects induced by a dominant-negative form of Dab1
(A-C) Venus+ neurons were detected by immunohistochemistry 6 days after electroporation with pCDNA3.1 empty (A) or containing Dab1 5YF (B, C) plasmid with pTα1-IRES-Venus (A, B) or pTα1-Cre-IRES-Venus (C) plasmid in LSL-Notch ICD mice. Note that 5YF arrested many neurons beneath the CP which was mitigated by overexpression of Notch ICD. (D) Quantification of neuronal distribution in the LSL-Notch ICD cortex electroporated with indicated plasmids (K-S test, p<0.05; Repeated Measures ANOVA, F(9,126)=5.24, p<0.05). The data represent the mean ± SEM of 6 brains each. (E-G) Venus+ neurons were detected by immunohistochemistry at P14 after E14.5 electroporation with pCALSL empty (E), containing Notch ICD (F) or caRbpj (G) with pTα1 -Cre-IRES-Venus and pCDNA3.1-Dab1 5YF plasmids in wild-type mice. Note that compared to control (E), overexpression of Notch ICD (F) or caRbpj (G) resulted in fewer neurons located beneath layer IV. (H) Percentages of Venus+ neurons below layer IV in P14 wild-type cortex electroporated with indicated plasmids. The data represent the mean ± SEM of 10, 8, and 11 brains, respectively. *,**p<0.01, 0.05, by Student’s t-test. Bars = 100 μm.
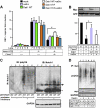
Figure 8. Stimulated Dab1 blocks Notch ICD degradation
(A) Effects of active Dab1 on Notch ICD activity. Relative Rbpj luciferase activity of each condition is compared to lane 1 set as 1.0. The indicated values are the mean ± SEM of three experiments performed in triplicate. *p<0.05, Student’s t test. (B) Cos-7 cells were transfected with indicated plasmids, and the expression of Notch1 ICD and GFP (as an internal control, reprobed on the same membrane) were analyzed by IB. The graphs show the relative intensity of the Notch1 ICD against the left lane after normalization with GFP as a transfection control. The data represents the mean ± SEM of 3 independent experiments. *p<0.01 paired t-test. Transfection of caSrc without Dab1 or Dab1 without caSrc constructs gave equivalent results to Dab1 5YF with/without caSrc. Transfection of caSrc with/without Dab1 constructs did not alter both endogenous and exogenous Fbxw7 expression levels (data not shown). (C) IB of lysates from rl/rl and rl/+ brain slices against polyubiquitin (FK2) and Notch1 after immunoprecipitation with a Notch1 antibody. IB against GAPDH was obtained from the flow-through of IP. The samples in the left 3 lanes were obtained from freshly prepared cortical slices, and the samples in right 3 lanes were from slices cultured with proteasome inhibitors. Note the decrease of precipitated non-polyubiquitinated Notch1 in Reeler (lanes 1’ and 4’), consistent with the increase of polyubiquitinated Notch1 (lanes 1 and 4). Arrow indicates p100-120 Notch1 ICD bands. Asterisk shows IgG bands. (D) IB of lysates from cultured cortical neurons transfected with the indicated plasmids against polyubiquitin (FK2) and myc after IP with a myc antibody. The transfected neurons were exposed to Reelin containing- or mock medium for 6 hours with protease inhibitors before collection. IB against GAPDH was obtained from the IP flow-through.
Comment in
- Strange bedfellows: Reelin and Notch signaling interact to regulate cell migration in the developing neocortex.
Gaiano N. Gaiano N. Neuron. 2008 Oct 23;60(2):189-91. doi: 10.1016/j.neuron.2008.10.009. Neuron. 2008. PMID: 18957210 Review.
Similar articles
- Reelin induces EphB activation.
Bouché E, Romero-Ortega MI, Henkemeyer M, Catchpole T, Leemhuis J, Frotscher M, May P, Herz J, Bock HH. Bouché E, et al. Cell Res. 2013 Apr;23(4):473-90. doi: 10.1038/cr.2013.7. Epub 2013 Jan 15. Cell Res. 2013. PMID: 23318582 Free PMC article. - Ephrin Bs are essential components of the Reelin pathway to regulate neuronal migration.
Sentürk A, Pfennig S, Weiss A, Burk K, Acker-Palmer A. Sentürk A, et al. Nature. 2011 Apr 21;472(7343):356-60. doi: 10.1038/nature09874. Epub 2011 Apr 3. Nature. 2011. PMID: 21460838 - Neurons tend to stop migration and differentiate along the cortical internal plexiform zones in the Reelin signal-deficient mice.
Tabata H, Nakajima K. Tabata H, et al. J Neurosci Res. 2002 Sep 15;69(6):723-30. doi: 10.1002/jnr.10345. J Neurosci Res. 2002. PMID: 12205665 - Strange bedfellows: Reelin and Notch signaling interact to regulate cell migration in the developing neocortex.
Gaiano N. Gaiano N. Neuron. 2008 Oct 23;60(2):189-91. doi: 10.1016/j.neuron.2008.10.009. Neuron. 2008. PMID: 18957210 Review. - Role of Reelin in the development and maintenance of cortical lamination.
Frotscher M, Chai X, Bock HH, Haas CA, Förster E, Zhao S. Frotscher M, et al. J Neural Transm (Vienna). 2009 Nov;116(11):1451-5. doi: 10.1007/s00702-009-0228-7. Epub 2009 Apr 25. J Neural Transm (Vienna). 2009. PMID: 19396394 Review.
Cited by
- Extracellular Matrix Regulation of Stem Cell Behavior.
Ahmed M, Ffrench-Constant C. Ahmed M, et al. Curr Stem Cell Rep. 2016;2(3):197-206. doi: 10.1007/s40778-016-0056-2. Epub 2016 Jul 7. Curr Stem Cell Rep. 2016. PMID: 27547708 Free PMC article. Review. - Tcf4 Controls Neuronal Migration of the Cerebral Cortex through Regulation of Bmp7.
Chen T, Wu Q, Zhang Y, Lu T, Yue W, Zhang D. Chen T, et al. Front Mol Neurosci. 2016 Oct 3;9:94. doi: 10.3389/fnmol.2016.00094. eCollection 2016. Front Mol Neurosci. 2016. PMID: 27752241 Free PMC article. - BEND6 is a nuclear antagonist of Notch signaling during self-renewal of neural stem cells.
Dai Q, Andreu-Agullo C, Insolera R, Wong LC, Shi SH, Lai EC. Dai Q, et al. Development. 2013 May;140(9):1892-902. doi: 10.1242/dev.087502. Development. 2013. PMID: 23571214 Free PMC article. - Reelin Functions, Mechanisms of Action and Signaling Pathways During Brain Development and Maturation.
Jossin Y. Jossin Y. Biomolecules. 2020 Jun 26;10(6):964. doi: 10.3390/biom10060964. Biomolecules. 2020. PMID: 32604886 Free PMC article. Review. - Epilepsy as a neurodevelopmental disorder.
Bozzi Y, Casarosa S, Caleo M. Bozzi Y, et al. Front Psychiatry. 2012 Mar 19;3:19. doi: 10.3389/fpsyt.2012.00019. eCollection 2012. Front Psychiatry. 2012. PMID: 22457654 Free PMC article.
References
- Ayala R, Shu T, Tsai LH. Trekking across the brain: the journey of neuronal migration. Cell. 2007;128:29–43. - PubMed
- Baba K, Dekimoto H, Muraoka D, Agata K, Terashima T, Katsuyama Y. A mouse homologue of Strawberry Notch is transcriptionally regulated by Reelin signal. Biochem. Biophys. Res. Commun. 2006;350:842–849. - PubMed
- Ballif BA, Arnaud L, Arthur WT, Guris D, Imamoto A, Cooper JA. Activation of a Dab1/CrkL/C3G/Rap1 pathway in Reelin-stimulated neurons. Curr.Biol. 2004;14:606–610. - PubMed
Publication types
MeSH terms
Substances
Grants and funding
- R01 HD045481/HD/NICHD NIH HHS/United States
- R01 NS014841/NS/NINDS NIH HHS/United States
- R01 AG019394-05/AG/NIA NIH HHS/United States
- R01 AG019394/AG/NIA NIH HHS/United States
- R01 NS041783/NS/NINDS NIH HHS/United States
- T32 GM007205/GM/NIGMS NIH HHS/United States
- 5R01 NS014841-30/NS/NINDS NIH HHS/United States
- R01 NS014841-30/NS/NINDS NIH HHS/United States
LinkOut - more resources
Full Text Sources
Other Literature Sources
Molecular Biology Databases
