Frequency-independent synaptic transmission supports a linear vestibular behavior - PubMed (original) (raw)
Frequency-independent synaptic transmission supports a linear vestibular behavior
Martha W Bagnall et al. Neuron. 2008.
Abstract
The vestibular system is responsible for transforming head motion into precise eye, head, and body movements that rapidly stabilize gaze and posture. How do central excitatory synapses mediate behavioral outputs accurately matched to sensory inputs over a wide dynamic range? Here we demonstrate that vestibular afferent synapses in vitro express frequency-independent transmission that spans their in vivo dynamic range (5-150 spikes/s). As a result, the synaptic charge transfer per unit time is linearly related to vestibular afferent activity in both projection and intrinsic neurons of the vestibular nuclei. Neither postsynaptic glutamate receptor desensitization nor saturation affect the relative amplitude or frequency-independence of steady-state transmission. Finally, we show that vestibular nucleus neurons can transduce synaptic inputs into linear changes in firing rate output without relying on one-to-one calyceal transmission. These data provide a physiological basis for the remarkable linearity of vestibular reflexes.
Figures
Figure 1. Linear relationship between head velocity and compensatory eye velocity
A, The basic circuitry of the vestibulo-ocular reflex; the vestibular nerve afferent synapse onto vestibular nucleus neurons (shaded) is the focus of this study. B, In the dark, mice were rotated sinusoidally in the horizontal plane at a frequency of 1 Hz. Example of eye and head velocity in one mouse. Instantaneous eye velocity is shown in gray, with sinusoidal fit in black. C, Summary data for six mice showing that eye velocity was a linear function of head motion at 1 Hz over a wide range of velocities. Error bars represent SD and in most cases are smaller than the symbols.
Figure 2. EPSCs from vestibular afferents exhibit rapid kinetics and little paired-pulse modulation
A, Example EPSCs resulting from increasing stimulation intensities of the vestibular nerve in slice preparation, recorded from neurons labeled in the YFP-16 line (left) and the GIN line (right). Stimulation artifacts are blanked for clarity. T = threshold stimulation intensity. B, The maximum EPSC amplitude that could be elicited in YFP-16 neurons was 3-fold higher than that in GIN neurons (p < 0.0001). Two YFP-16 neurons had maximal EPSCs of 5–6 nA (not shown for graphical clarity). C, EPSC 10–90% rise times are rapid both in YFP-16 neurons and GIN neurons. D, EPSC 90–10% decay times (see Experimental Procedures) are also swift in YFP-16 and GIN neurons. Kinetics were usually measured at 1.5–3x the threshold stimulation intensity. Horizontal bars represent medians. E, Paired pulse. Examples of EPSCs elicited at a 10 ms interval in a YFP-16 (left) and GIN (right) neuron. F, Summary of paired-pulse ratios (100*EPSC2/EPSC1) across interstimulus intervals from 5 ms to 10 s. EPSCs in both YFP-16 and GIN neurons depressed to ~85% of their original values at stimulus intervals from 5 ms to 1 s, with no history dependence visible at intervals of 10 s. N = 3–10 cells per data point. Data are shown as mean ± SEM in this and subsequent figures.
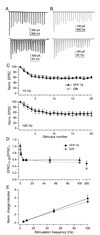
Figure 3. Trains of stimuli evoke frequency-independent steady-state depression
A, EPSCs measured in a YFP-16 neuron during vestibular nerve stimulation at 10 Hz (top) or 100 Hz (bottom). B, Same as A, GIN neuron. In both examples, EPSCs rapidly achieve a steady-state plateau of ~60% of the initial value, regardless of stimulation frequency. C, Population data from both YFP-16 (n = 8) and GIN neurons (n = 11) with trains of 20 stimuli elicited at 10 Hz. D, Population data from YFP-16 (n = 7) and GIN neurons (n = 8) with trains of 20 stimuli elicited at 100 Hz. D, Summary of the magnitude of steady-state depression, defined as the average of EPSC11–20 divided by EPSC1, across stimulation frequencies from 0.1 to 200 Hz. In the steady state, EPSC amplitude does not depend on stimulation frequency from 5 to 100 Hz in either YFP-16 or GIN neurons. E, Total charge transfer per second during steady-state transmission increases linearly with increasing stimulation frequency (R2 = 1 for both neuron types). Charge transfer was calculated as the average integrated area under the EPSC in steady state (EPSC11–20), normalized to initial EPSC amplitude, and multiplied by the rate of stimulation.
Figure 4. Postsynaptic receptor desensitization and saturation do not affect short-term plasticity
A, Example EPSC elicited by vestibular nerve stimulation in a YFP-16 neuron (black). Cyclothiazide (100 µm; gray) increased EPSC amplitude and slowed its decay, as is evident in the experimental trace peak-scaled to control (dotted line). B, No difference is seen in steady-state depression of synaptic currents in the presence of cyclothiazide at 50 Hz (shown) or other frequencies tested (n = 6). C, Summary of kinetics and steady-state depression across the population. The peak EPSC amplitude and the 80-20% decay time were both significantly increased by cyclothiazide (n = 6; p < 0.05). Steady-state depression, quantified as EPSC11-20/EPSC1, was unaffected. D, Example EPSC elicited in a YFP-16 neuron. γ-DGG (2 mM; gray) reduced EPSC amplitude without significantly affecting kinetics (scaled trace, dotted line). E, Reducing receptor saturation does not affect short-term depression at 50 Hz (shown) or other frequencies tested (n = 6). F, Summary of kinetics and steady-state depression across the population. EPSC amplitude was significantly reduced (p < 0.05) while other parameters were unaffected.
Figure 5. The amplitude of steady state transmission is not affected by changes in stimulation rate
A, Example EPSCs recorded in a YFP-16 neuron during vestibular afferent stimulation with 20 pulses at 10 Hz followed by 20 pulses at 50 Hz (left) and 50 Hz followed by 10 Hz (right). Group data indicate that EPSC amplitudes were not affected by stimulus shifts from 10 Hz to 50 Hz (B, n=8) or from 50 Hz to 10 Hz (C, n=9). D, Naturalistic stimulus train, displayed as instantaneous rate vs time, that approximates the firing pattern of a typical mouse vestibular afferent firing during head movements (see Experimental Procedures). E, Average EPSC responses to the naturalistic stimulus shown in D (n = 7). EPSC amplitude decreased rapidly to a steady state level that was not affected by instantaneous variations in stimulus rate. F, Replotting the data from E demonstrated that EPSC amplitude did not depend on interstimulus interval. The responses to the first five stimuli have been omitted from this plot for clarity.
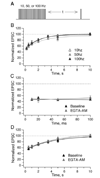
Figure 6. Recovery of EPSC amplitudes from depression is slow and monoexponential
A, Vestibular afferents were stimulated with conditioning trains of 20 pulses at 10, 50, or 100 Hz, followed by a test pulse at a variable time afterwards. B, Recovery from depression was best fit with a single exponential. The tau of recovery was similar across the three conditioning frequencies of 10, 50, and 100 Hz (2.2, 2.5, and 1.9 s respectively; n = 5). C, EPSCs did not recover in amplitude during shorter intervals (10–100 ms, all tested with 50 Hz conditioning train). Application of 100 µM EGTA-AM for 5 min had no effect on recovery (n = 4). D, EGTA-AM had no effect on the timecourse of recovery for longer test intervals (conditioning train, 50 Hz; n = 7).
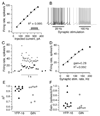
Figure 7. Injected and synaptic currents can each drive linear increases in MVN firing rates
A, The firing rate of an example YFP-16 neuron during 1 s steps of depolarizing somatic current injection of varying amplitudes (inset). Neuronal firing rates, averaged over the 1 s step, were linearly related to injected current. B, Synaptic stimulation for 1 s drives increases in firing rate in the same neuron shown in A. Somatic current injection was used to maintain a stable baseline firing rate of ~5 Hz. C, The postsynaptic firing rate in this neuron at the two synaptic stimulation rates shown (20 and 100 Hz). D, Linear input to firing rate relationship for the neuron shown in C. The slope is less than 1, indicating the linear synaptic summation of input currents over time. E, Summary of goodness of linear fits in response to stimuli that ranged from 20 to 150 Hz rates in the population of YFP-16 and GIN neurons. F, Summary of firing response gains across the same population. Of the 8 GIN and 10 YFP-16 neurons tested, only one fired action potentials with every presynaptic stimulus (gain = 1).
Similar articles
- Dynamics of glutamatergic synapses in the medial vestibular nucleus of the mouse.
Broussard DM. Broussard DM. Eur J Neurosci. 2009 Feb;29(3):502-17. doi: 10.1111/j.1460-9568.2008.06604.x. Epub 2009 Jan 19. Eur J Neurosci. 2009. PMID: 19175402 - Presynaptic and postsynaptic ion channel expression in vestibular nuclei neurons after unilateral vestibular deafferentation.
Shao M, Popratiloff A, Hirsch JC, Peusner KD. Shao M, et al. J Vestib Res. 2009;19(5-6):191-200. doi: 10.3233/VES-2009-0348. J Vestib Res. 2009. PMID: 20495236 Review. - Intrinsic and synaptic plasticity in the vestibular system.
Gittis AH, du Lac S. Gittis AH, et al. Curr Opin Neurobiol. 2006 Aug;16(4):385-90. doi: 10.1016/j.conb.2006.06.012. Epub 2006 Jul 13. Curr Opin Neurobiol. 2006. PMID: 16842990 Review. - Implications of noise and neural heterogeneity for vestibulo-ocular reflex fidelity.
Hospedales TM, van Rossum MC, Graham BP, Dutia MB. Hospedales TM, et al. Neural Comput. 2008 Mar;20(3):756-78. doi: 10.1162/neco.2007.09-06-339. Neural Comput. 2008. PMID: 18045014 - Effects of 17beta-estradiol on glutamate synaptic transmission and neuronal excitability in the rat medial vestibular nuclei.
Grassi S, Frondaroli A, Scarduzio M, Dutia MB, Dieni C, Pettorossi VE. Grassi S, et al. Neuroscience. 2010 Feb 17;165(4):1100-14. doi: 10.1016/j.neuroscience.2009.11.039. Epub 2009 Nov 26. Neuroscience. 2010. PMID: 19944747
Cited by
- Short-term presynaptic plasticity.
Regehr WG. Regehr WG. Cold Spring Harb Perspect Biol. 2012 Jul 1;4(7):a005702. doi: 10.1101/cshperspect.a005702. Cold Spring Harb Perspect Biol. 2012. PMID: 22751149 Free PMC article. Review. - Improvement of Mechanical Stability for Single Unit Recording Based on Skull Cap in Living Chinchilla.
Ren PY, Li BW, Dong SY, Wu M, Han P. Ren PY, et al. Curr Med Sci. 2019 Feb;39(1):166-172. doi: 10.1007/s11596-019-2015-5. Epub 2019 Mar 13. Curr Med Sci. 2019. PMID: 30868508 - Bassoon speeds vesicle reloading at a central excitatory synapse.
Hallermann S, Fejtova A, Schmidt H, Weyhersmüller A, Silver RA, Gundelfinger ED, Eilers J. Hallermann S, et al. Neuron. 2010 Nov 18;68(4):710-23. doi: 10.1016/j.neuron.2010.10.026. Neuron. 2010. PMID: 21092860 Free PMC article. - The reliability of nonlinear least-squares algorithm for data analysis of neural response activity during sinusoidal rotational stimulation in semicircular canal neurons.
Ren P, Li B, Dong S, Chen L, Zhang Y. Ren P, et al. PLoS One. 2018 Jan 5;13(1):e0190596. doi: 10.1371/journal.pone.0190596. eCollection 2018. PLoS One. 2018. PMID: 29304173 Free PMC article. - Multisensory integration in early vestibular processing in mice: the encoding of passive vs. active motion.
Medrea I, Cullen KE. Medrea I, et al. J Neurophysiol. 2013 Dec;110(12):2704-17. doi: 10.1152/jn.01037.2012. Epub 2013 Oct 2. J Neurophysiol. 2013. PMID: 24089394 Free PMC article.
References
- Abbott LF, Regehr WG. Synaptic computation. Nature. 2004;431:796–803. - PubMed
- Abbott LF, Varela JA, Sen K, Nelson SB. Synaptic depression and cortical gain control. Science. 1997;275:220–224. - PubMed
- Angelaki DE, Cullen KE. Vestibular system: the many facets of a multimodal sense. Annu Rev Neurosci. 2008;31:125–150. - PubMed
- Babalian A, Vibert N, Assie G, Serafin M, Muhlethaler M, Vidal PP. Central vestibular networks in the guinea-pig: functional characterization in the isolated whole brain in vitro. Neuroscience. 1997;81:405–426. - PubMed
Publication types
MeSH terms
Substances
LinkOut - more resources
Full Text Sources
Other Literature Sources
Molecular Biology Databases
Research Materials


