Aneuploidy affects proliferation and spontaneous immortalization in mammalian cells - PubMed (original) (raw)
Aneuploidy affects proliferation and spontaneous immortalization in mammalian cells
Bret R Williams et al. Science. 2008.
Abstract
Aneuploidy, an incorrect number of chromosomes, is the leading cause of miscarriages and mental retardation in humans and is a hallmark of cancer. We examined the effects of aneuploidy on primary mouse cells by generating a series of cell lines that carry an extra copy of one of four mouse chromosomes. In all four trisomic lines, proliferation was impaired and metabolic properties were altered. Immortalization, the acquisition of the ability to proliferate indefinitely, was also affected by the presence of an additional copy of certain chromosomes. Our data indicate that aneuploidy decreases not only organismal but also cellular fitness and elicits traits that are shared between different aneuploid cells.
Figures
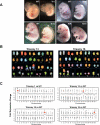
Fig. 1. Generation of trisomic embryos and mouse embryonic fibroblast (MEF) cell lines
(A) Trisomic (Ts) embryos were recovered by timed matings. The trisomy 1 (Ts1) embryo was recovered at 10.5 days postcoitum (dpc). Ts13, Ts16 and Ts19 embryos were recovered at 14.5 or 15.5dpc. In all instances Ts embryos were identified by their developmental abnormalities and reduced size (7). (B) Examples of Spectral karyotype (SKY) analysis of metaphase spreads prepared from early passage (≤p3) Chr13 and Chr16 trisomic MEFs. Chromosomes and Robertsonian translocations are identified. (C) Gene expression pattern of aneuploid cell lines and lines from euploid littermate controls (12). Transcripts were binned by chromosome and the average gene expression/total chromosome is shown. The asterisk indicates the identity of the trisomic chromosome. The increase in gene expression was highly significant (p≤ 1x10−74, all trisomies, Student's t-Test).
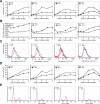
Fig. 2. Proliferation defects in trisomic MEFs
Wild type (open circles) and Ts cells (closed circles) were plated and counted daily for cell number increase (12). Error bars are +/− SD. The data for each column come from the same cell line. (A) Growth of early passage (p3) trisomic cells under “unfed” (medium was not changed) conditions. (B, C) Average cell volume of cells under growth conditions where the medium was not changed (unfed; B) and the distribution of cell volumes in the culture at day 5 of the accumulation assay (C). Note that the low amounts of small size particles in (C) indicate that cells are not undergoing lysis. (D) Analysis of the cumulative cell volume (CCV) (number of cells x average cell volume) during the proliferation assay in A. Error bars are +/− SD. (E) DNA content analysis of asynchronous wild-type and trisomic cells
Fig. 3. Cellular metabolism in trisomic MEFs
(A – C) Tissue culture supernatants of proliferation experiments were subjected to metabolic analyses (12) and the amount of glutamine used (A) and ammonium (B) and lactate (C) generated per cumulative cell volume was determined at the indicated times. The data for each column come from the same cell line. Error bars are +/− SD. (D) The table summarizes the changes in cell proliferation, cell and cumulative cell volume a well as glucose and glutamine uptake and production of glutamate, ammonium and lactate. These _p_-values are shown for measurements of the proliferation assays. _P_-values were determined through a 2-way nested ANOVA with standard statistical packages for values obtained for days 3, 5 and 7 (Table S4). Values below p=0.05 were interpreted to mean that the values obtained were either significantly increased or reduced. _P_-values > 0.06 were interpreted to mean no difference between Ts line and wild-type. The asterisk denotes that cell number, cell volume, and cumulative cell volume was determined for 4 trisomy 16 cell lines, whereas the metabolic analyses were performed with three Ts16 lines.
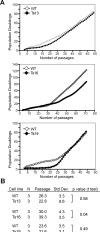
Fig. 4. Rates of spontaneous immortalization of primary aneuploid MEFs
(A) Cells were serially passed in a 3T3 immortalization assay (12) and the number of population doublings are shown as a function of number of passages. (B) The mean number of passages (passage) until immortalization was calculated as described (12). The standard deviations are shown in the column to the right. _P_-values are given in the last column. Note that the average number of passages until immortalization for the Ts16 cell lines does not include the Ts16 cell line that failed to immortalize. Note that for Ts19 two of the three immortalization assays were performed in independent experiments with cells obtained from the same embryo.
Comment in
- Cancer. Aneuploidy advantages?
Hernando E. Hernando E. Science. 2008 Oct 31;322(5902):692-3. doi: 10.1126/science.1166151. Science. 2008. PMID: 18974340 No abstract available. - The aneuploidy paradox in cell growth and tumorigenesis.
Weaver BA, Cleveland DW. Weaver BA, et al. Cancer Cell. 2008 Dec 9;14(6):431-3. doi: 10.1016/j.ccr.2008.11.011. Cancer Cell. 2008. PMID: 19061834 Free PMC article.
Similar articles
- Aneuploid embryonic stem cells exhibit impaired differentiation and increased neoplastic potential.
Zhang M, Cheng L, Jia Y, Liu G, Li C, Song S, Bradley A, Huang Y. Zhang M, et al. EMBO J. 2016 Nov 2;35(21):2285-2300. doi: 10.15252/embj.201593103. Epub 2016 Aug 24. EMBO J. 2016. PMID: 27558554 Free PMC article. - Identification of aneuploidy-selective antiproliferation compounds.
Tang YC, Williams BR, Siegel JJ, Amon A. Tang YC, et al. Cell. 2011 Feb 18;144(4):499-512. doi: 10.1016/j.cell.2011.01.017. Cell. 2011. PMID: 21315436 Free PMC article. - Segmental trisomy of chromosome 17: a mouse model of human aneuploidy syndromes.
Vacík T, Ort M, Gregorová S, Strnad P, Blatny R, Conte N, Bradley A, Bures J, Forejt J. Vacík T, et al. Proc Natl Acad Sci U S A. 2005 Mar 22;102(12):4500-5. doi: 10.1073/pnas.0500802102. Epub 2005 Mar 8. Proc Natl Acad Sci U S A. 2005. PMID: 15755806 Free PMC article. - Autosomal aneuploidy in mice: generation and developmental consequences.
Gearhart JD, Davisson MT, Oster-Granite ML. Gearhart JD, et al. Brain Res Bull. 1986 Jun;16(6):789-801. doi: 10.1016/0361-9230(86)90075-4. Brain Res Bull. 1986. PMID: 3530382 Review. - Consequences of gaining an extra chromosome.
Torres EM. Torres EM. Chromosome Res. 2023 Aug 25;31(3):24. doi: 10.1007/s10577-023-09732-w. Chromosome Res. 2023. PMID: 37620607 Free PMC article. Review.
Cited by
- Genomic instability and colon carcinogenesis: from the perspective of genes.
Rao CV, Yamada HY. Rao CV, et al. Front Oncol. 2013 May 21;3:130. doi: 10.3389/fonc.2013.00130. eCollection 2013. Front Oncol. 2013. PMID: 23734346 Free PMC article. - Multiple-low-dose therapy: effective killing of high-grade serous ovarian cancer cells with ATR and CHK1 inhibitors.
Golder A, Nelson L, Tighe A, Barnes B, Coulson-Gilmer C, Morgan RD, McGrail JC, Taylor SS. Golder A, et al. NAR Cancer. 2022 Nov 12;4(4):zcac036. doi: 10.1093/narcan/zcac036. eCollection 2022 Dec. NAR Cancer. 2022. PMID: 36381271 Free PMC article. - Global analysis of genome, transcriptome and proteome reveals the response to aneuploidy in human cells.
Stingele S, Stoehr G, Peplowska K, Cox J, Mann M, Storchova Z. Stingele S, et al. Mol Syst Biol. 2012;8:608. doi: 10.1038/msb.2012.40. Mol Syst Biol. 2012. PMID: 22968442 Free PMC article. - Clinical Applications of Aneuploidies in Evolution of NSCLC Patients: Current Status and Application Prospect.
Yan X, Liu SM, Liu C. Yan X, et al. Onco Targets Ther. 2022 Nov 10;15:1355-1368. doi: 10.2147/OTT.S380016. eCollection 2022. Onco Targets Ther. 2022. PMID: 36388157 Free PMC article. Review. - Epigenetic and developmental regulation in plant polyploids.
Song Q, Chen ZJ. Song Q, et al. Curr Opin Plant Biol. 2015 Apr;24:101-9. doi: 10.1016/j.pbi.2015.02.007. Epub 2015 Mar 10. Curr Opin Plant Biol. 2015. PMID: 25765928 Free PMC article. Review.
References
- Torres EM, et al. Science. 2007 Aug 17;317:916. - PubMed
- Niwa O, Tange Y, Kurabayashi A. Yeast. 2006 Oct 15;23:937. - PubMed
- Niwa O, Yanagida M. Current Genetics. 1985;9:463. - PubMed
Publication types
MeSH terms
Substances
LinkOut - more resources
Full Text Sources
Other Literature Sources
Molecular Biology Databases


