Trends in prokaryotic evolution revealed by comparison of closely related bacterial and archaeal genomes - PubMed (original) (raw)
Trends in prokaryotic evolution revealed by comparison of closely related bacterial and archaeal genomes
Pavel S Novichkov et al. J Bacteriol. 2009 Jan.
Abstract
In order to explore microevolutionary trends in bacteria and archaea, we constructed a data set of 41 alignable tight genome clusters (ATGCs). We show that the ratio of the medians of nonsynonymous to synonymous substitution rates (dN/dS) that is used as a measure of the purifying selection pressure on protein sequences is a stable characteristic of the ATGCs. In agreement with previous findings, parasitic bacteria, notwithstanding the sometimes dramatic genome shrinkage caused by gene loss, are typically subjected to relatively weak purifying selection, presumably owing to relatively small effective population sizes and frequent bottlenecks. However, no evidence of genome streamlining caused by strong selective pressure was found in any of the ATGCs. On the contrary, a significant positive correlation between the genome size, as well as gene size, and selective pressure was observed, although a variety of free-living prokaryotes with very close selective pressures span nearly the entire range of genome sizes. In addition, we examined the connections between the sequence evolution rate and other genomic features. Although gene order changes much faster than protein sequences during the evolution of prokaryotes, a strong positive correlation was observed between the "rearrangement distance" and the amino acid distance, suggesting that at least some of the events leading to genome rearrangement are subjected to the same type of selective constraints as the evolution of amino acid sequences.
Figures
FIG. 1.
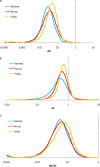
Distributions of dS, dN, and dN/dS in orthologous gene sets from three genome pairs from different ATGCs. (a) Distribution (probability density) of dN. (b) Distribution (probability density) of dS. (c) Distribution (probability density) of dN/dS. Metma, Methanococcus maripaludis C5-M. maripaludis C7 (Euryarchaeota); Bursp, Burkholderia cenocepacia MC0-3-Burkholderia vietnamiensis G4 (Betaproteobacteria); Salsp, Salinispora arenicola CNS-205-Salinispora tropica CNB-440 (Actinobacteria). The distribution curves were obtained by Gaussian-kernel smoothing of the individual data points (28).
FIG. 2.
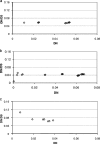
Dependence of DN/DS on the distance between genomes, measured as DN. Each point corresponds to a pair of genomes in the given ATGC. (a) Xanthomonas sp. (b) Shewanella sp. (c) P. marinus.
FIG. 3.
Distribution (probability density) of DN/DS in the 41 analyzed ATGCs. The distribution curve was obtained by Gaussian-kernel smoothing of the individual data points (28).
FIG. 4.
Correlations between the purifying selection pressure (DN/DS) and other genomic variables. (a) DN/DS versus genome size. (b) DN/DS versus intergenic-region size. (c) DN/DS versus gene density. (d) DN/DS versus protein-coding-gene size. The dashed lines show linear regressions. Rs, Spearman ranking correlation coefficient.
FIG. 5.
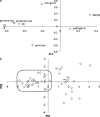
PCA of seven genomic variables. (a) Loadings of the first two PCs. (b) Scatter of the ATGCs in the plane of the first two PCs. The red contour encloses the tight cluster of genomes, mostly those of free-living organisms, that are subjeced to relatively strong purifying selection. The three ATGCs that include various strains of P. marinus are denoted Pm.
FIG. 6.
Patterns of genome rearrangement in prokaryotes. (a) Nearly complete decay of synteny (DY = 0.69; DN = 0.15; DS ≫ 1); Streptococcus sanguinis SK36 and Streptococcus pneumoniae R6. (b) Virtual absence of rearrangement (DY ∼ 0; DN = 0.06; DS = 1.12); Chlamydophila caviae GPIC and Chlamydophila abortus S26/3. (c) Multiple inversions with limited transposition of individual genes (DY ∼ 0; DN = 0; DS = 0); Yersinia pestis Antiqua and Y. pestis CO92. (d) No inversion; hot spots of transposition of individual genes (DY = 0.04; DN = 0.03; DS = 0.41); P. marinus AS9601 and P. marinus MIT 9215. (e) Multiple inversions and transposition of individual genes (DY = 0.16; DN = 0.08; DS = 1.35); Pseudomonas fluorescens PfO-1 and P. fluorescens Pf-5.
FIG. 7.
Correlation between the mean purifying selection pressures affecting amino acid sequence evolution (DN/DS) and genome rearrangement (DY/DS). Rs, Spearman ranking correlation coefficient.
Similar articles
- Increased Mutation Rate Is Linked to Genome Reduction in Prokaryotes.
Bourguignon T, Kinjo Y, Villa-Martín P, Coleman NV, Tang Q, Arab DA, Wang Z, Tokuda G, Hongoh Y, Ohkuma M, Ho SYW, Pigolotti S, Lo N. Bourguignon T, et al. Curr Biol. 2020 Oct 5;30(19):3848-3855.e4. doi: 10.1016/j.cub.2020.07.034. Epub 2020 Aug 6. Curr Biol. 2020. PMID: 32763167 - Theory of prokaryotic genome evolution.
Sela I, Wolf YI, Koonin EV. Sela I, et al. Proc Natl Acad Sci U S A. 2016 Oct 11;113(41):11399-11407. doi: 10.1073/pnas.1614083113. Epub 2016 Oct 4. Proc Natl Acad Sci U S A. 2016. PMID: 27702904 Free PMC article. - Growth temperature and genome size in bacteria are negatively correlated, suggesting genomic streamlining during thermal adaptation.
Sabath N, Ferrada E, Barve A, Wagner A. Sabath N, et al. Genome Biol Evol. 2013;5(5):966-77. doi: 10.1093/gbe/evt050. Genome Biol Evol. 2013. PMID: 23563968 Free PMC article. - Genomic and phylogenetic perspectives on the evolution of prokaryotes.
Brown JR. Brown JR. Syst Biol. 2001 Aug;50(4):497-512. doi: 10.1080/10635150117729. Syst Biol. 2001. PMID: 12116649 Review. - Flexible genomic islands as drivers of genome evolution.
Rodriguez-Valera F, Martin-Cuadrado AB, López-Pérez M. Rodriguez-Valera F, et al. Curr Opin Microbiol. 2016 Jun;31:154-160. doi: 10.1016/j.mib.2016.03.014. Epub 2016 Apr 14. Curr Opin Microbiol. 2016. PMID: 27085300 Review.
Cited by
- Evaluating the Safety of Bacillus cereus GW-01 Obtained from Sheep Rumen Chyme.
Xu B, Huang X, Qin H, Lei Y, Zhao S, Liu S, Liu G, Zhao J. Xu B, et al. Microorganisms. 2024 Jul 18;12(7):1457. doi: 10.3390/microorganisms12071457. Microorganisms. 2024. PMID: 39065225 Free PMC article. - Comparison of a Modern and Fossil Pithovirus Reveals Its Genetic Conservation and Evolution.
Levasseur A, Andreani J, Delerce J, Bou Khalil J, Robert C, La Scola B, Raoult D. Levasseur A, et al. Genome Biol Evol. 2016 Aug 25;8(8):2333-9. doi: 10.1093/gbe/evw153. Genome Biol Evol. 2016. PMID: 27389688 Free PMC article. - Functional and evolutionary significance of unknown genes from uncultivated taxa.
Rodríguez Del Río Á, Giner-Lamia J, Cantalapiedra CP, Botas J, Deng Z, Hernández-Plaza A, Munar-Palmer M, Santamaría-Hernando S, Rodríguez-Herva JJ, Ruscheweyh HJ, Paoli L, Schmidt TSB, Sunagawa S, Bork P, López-Solanilla E, Coelho LP, Huerta-Cepas J. Rodríguez Del Río Á, et al. Nature. 2024 Feb;626(7998):377-384. doi: 10.1038/s41586-023-06955-z. Epub 2023 Dec 18. Nature. 2024. PMID: 38109938 Free PMC article. - Strong Purifying Selection Is Associated with Genome Streamlining in Epipelagic Marinimicrobia.
Martinez-Gutierrez CA, Aylward FO. Martinez-Gutierrez CA, et al. Genome Biol Evol. 2019 Oct 1;11(10):2887-2894. doi: 10.1093/gbe/evz201. Genome Biol Evol. 2019. PMID: 31539038 Free PMC article. - Horizontal Gene Acquisitions Contributed to Genome Expansion in Insect-Symbiotic Spiroplasma clarkii.
Tsai YM, Chang A, Kuo CH. Tsai YM, et al. Genome Biol Evol. 2018 Jun 1;10(6):1526-1532. doi: 10.1093/gbe/evy113. Genome Biol Evol. 2018. PMID: 29860283 Free PMC article.
References
- Andersson, S. G., C. Alsmark, B. Canback, W. Davids, C. Frank, O. Karlberg, L. Klasson, B. Antoine-Legault, A. Mira, and I. Tamas. 2002. Comparative genomics of microbial pathogens and symbionts. Bioinformatics 18(Suppl. 2)S17. - PubMed
- Dandekar, T., B. Snel, M. Huynen, and P. Bork. 1998. Conservation of gene order: a fingerprint of proteins that physically interact. Trends Biochem. Sci. 23324-328. - PubMed
Publication types
MeSH terms
LinkOut - more resources
Full Text Sources
Other Literature Sources


