Bioinformatics resources for the study of gene regulation in bacteria - PubMed (original) (raw)
Review
Bioinformatics resources for the study of gene regulation in bacteria
Julio Collado-Vides et al. J Bacteriol. 2009 Jan.
No abstract available
Figures
FIG. 1.
Number of published particles per organism. We searched through PubMed by using a collection of keywords that we regularly use to gather information for RegulonDB across different bacteria. The profile requires the name of the organism to be in the title.
FIG. 2.
Distribution of TFBSs. RegulonDB version 6.2 has 697 σ70 promoters, 421 of which have at least one characterized binding site for a TF. The figure displays the distribution of central positions of activator and repressor DNA-binding sites in the −95 to +20 interval. The percentage of promoters was divided by the number of activator or repressor DNA-binding sites with the center position within each interval of 10 bp. This figure can be compared to Fig. 2 in reference .
FIG. 3.
Intergenic distances of genes within and at transcription unit boundaries. The sharply different distributions of these distances enabled the use of a direct method to predict transcription units in the complete E. coli genome. This figure is very similar to Fig. 3 in reference .
FIG. 4.
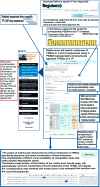
Flowchart for gathering all regulation information for a single gene. Navigation options are shown, starting from the main page of RegulonDB with the name of a gene, melA or melR in this example. The MelR-CRP complex regulon is shown.
FIG. 5.
Flowchart for ChIP-chip data and genes with similar DNA-binding site motifs. The example uses as input a set of genes from a ChIP-chip experiment with LexA (109). RSAT (99, 105) was used to obtain the collection of upstream sequences, given the ChIP-chip gene set. The position-specific matrix (PSSM) for LexA was obtained by selecting Downloads → Data sets → Matrix alignment from the RegulonDB main menu. Then, it was pasted into RSAT to run a matrix scan. This program will search, given a threshold, for predicted sites in the complete set of upstream regions of the genome, and the results can be automatically obtained in a graphic display by using the feature map program.
Similar articles
- Distribution of IS5 in bacteria.
Schoner B, Schoner RG. Schoner B, et al. Gene. 1981 Dec;16(1-3):347-52. doi: 10.1016/0378-1119(81)90093-7. Gene. 1981. PMID: 6282702 - Mutational bias suggests that replication termination occurs near the dif site, not at Ter sites.
Hendrickson H, Lawrence JG. Hendrickson H, et al. Mol Microbiol. 2007 Apr;64(1):42-56. doi: 10.1111/j.1365-2958.2007.05596.x. Mol Microbiol. 2007. PMID: 17376071 - Bacterial regulatory networks are extremely flexible in evolution.
Lozada-Chávez I, Janga SC, Collado-Vides J. Lozada-Chávez I, et al. Nucleic Acids Res. 2006 Jul 13;34(12):3434-45. doi: 10.1093/nar/gkl423. Print 2006. Nucleic Acids Res. 2006. PMID: 16840530 Free PMC article. - Can laboratory reference strains mirror "real-world" pathogenesis?
Fux CA, Shirtliff M, Stoodley P, Costerton JW. Fux CA, et al. Trends Microbiol. 2005 Feb;13(2):58-63. doi: 10.1016/j.tim.2004.11.001. Trends Microbiol. 2005. PMID: 15680764 Review. - The regulation of transcription initiation in bacteria.
Reznikoff WS, Siegele DA, Cowing DW, Gross CA. Reznikoff WS, et al. Annu Rev Genet. 1985;19:355-87. doi: 10.1146/annurev.ge.19.120185.002035. Annu Rev Genet. 1985. PMID: 3936407 Review. No abstract available.
Cited by
- Redefining fundamental concepts of transcription initiation in bacteria.
Mejía-Almonte C, Busby SJW, Wade JT, van Helden J, Arkin AP, Stormo GD, Eilbeck K, Palsson BO, Galagan JE, Collado-Vides J. Mejía-Almonte C, et al. Nat Rev Genet. 2020 Nov;21(11):699-714. doi: 10.1038/s41576-020-0254-8. Epub 2020 Jul 14. Nat Rev Genet. 2020. PMID: 32665585 Free PMC article. Review. - In silico identification and experimental characterization of regulatory elements controlling the expression of the Salmonella csrB and csrC genes.
Martínez LC, Martínez-Flores I, Salgado H, Fernández-Mora M, Medina-Rivera A, Puente JL, Collado-Vides J, Bustamante VH. Martínez LC, et al. J Bacteriol. 2014 Jan;196(2):325-36. doi: 10.1128/JB.00806-13. Epub 2013 Nov 1. J Bacteriol. 2014. PMID: 24187088 Free PMC article. - Insights from the architecture of the bacterial transcription apparatus.
Iyer LM, Aravind L. Iyer LM, et al. J Struct Biol. 2012 Sep;179(3):299-319. doi: 10.1016/j.jsb.2011.12.013. Epub 2011 Dec 24. J Struct Biol. 2012. PMID: 22210308 Free PMC article. - Using RegulonDB, the Escherichia coli K-12 Gene Regulatory Transcriptional Network Database.
Salgado H, Martínez-Flores I, Bustamante VH, Alquicira-Hernández K, García-Sotelo JS, García-Alonso D, Collado-Vides J. Salgado H, et al. Curr Protoc Bioinformatics. 2018 Mar;61(1):1.32.1-1.32.30. doi: 10.1002/cpbi.43. Curr Protoc Bioinformatics. 2018. PMID: 30040192 Free PMC article.
References
- Abouhamad, W. N., and M. D. Manson. 1994. The dipeptide permease of Escherichia coli closely resembles other bacterial transport systems and shows growth-phase-dependent expression. Mol. Microbiol. 141077-1092. - PubMed
- Belyaeva, T. A., V. A. Rhodius, C. L. Webster, and S. J. Busby. 1998. Transcription activation at promoters carrying tandem DNA sites for the Escherichia coli cyclic AMP receptor protein: organisation of the RNA polymerase alpha subunits. J. Mol. Biol. 277789-804. - PubMed
Publication types
MeSH terms
Substances
Grants and funding
- R01 GM071962/GM/NIGMS NIH HHS/United States
- U24 GM077678/GM/NIGMS NIH HHS/United States
- GM077678/GM/NIGMS NIH HHS/United States
- R01 GM071962-05/GM/NIGMS NIH HHS/United States
LinkOut - more resources
Full Text Sources


