Expression of 24,426 human alternative splicing events and predicted cis regulation in 48 tissues and cell lines - PubMed (original) (raw)
. 2008 Dec;40(12):1416-25.
doi: 10.1038/ng.264. Epub 2008 Nov 2.
Affiliations
- PMID: 18978788
- PMCID: PMC3197713
- DOI: 10.1038/ng.264
Expression of 24,426 human alternative splicing events and predicted cis regulation in 48 tissues and cell lines
John C Castle et al. Nat Genet. 2008 Dec.
Abstract
Alternative pre-messenger RNA splicing influences development, physiology and disease, but its regulation in humans is not well understood, partially because of the limited scale at which the expression of specific splicing events has been measured. We generated the first genome-scale expression compendium of human alternative splicing events using custom whole-transcript microarrays monitoring expression of 24,426 alternative splicing events in 48 diverse human samples. Over 11,700 genes and 9,500 splicing events were differentially expressed, providing a rich resource for studying splicing regulation. An unbiased, systematic screen of 21,760 4-mer to 7-mer words for cis-regulatory motifs identified 143 RNA 'words' enriched near regulated cassette exons, including six clusters of motifs represented by UCUCU, UGCAUG, UGCU, UGUGU, UUUU and AGGG, which map to trans-acting regulators PTB, Fox, Muscleblind, CELF/CUG-BP, TIA-1 and hnRNP F/H, respectively. Each cluster showed a distinct pattern of genomic location and tissue specificity. For example, UCUCU occurs 110 to 35 nucleotides preceding cassette exons upregulated in brain and striated muscle but depleted in other tissues. UCUCU and UGCAUG seem to have similar function but independent action, occurring 5' and 3', respectively, of 33% of the cassette exons upregulated in skeletal muscle but co-occurring for only 2%.
Figures
Figure 1
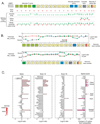
Interrogation of A2BP1 (Fox-1) isoforms on the alternative splicing microarrays. A) The nineteen exons in the locus, including alternative 5' exons (green), mutually exclusive exons (blue), a cassette exon (gray), and an alternative 3' splice site (red). Exon (red) and exon-exon junction (green) probes are displayed for several splice-related microarrays. B) Expression (log10 fold-change to reference pool) of exons (red dots) and junctions (green crosses) in transcripts NM_018723 and NM_145893 in skeletal muscle (cyan line) and brain (red line). C) Expression of the gene, exon 15, exon 14, and the combined splice event expression level. Red shading represents microarray intensity values; dark pink shading (right) represents more significant p-values.
Figure 2
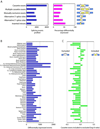
A) The number of events monitored on the arrays and the percentage of each type differentially expressed in at least one tissue. B) The number of events differentially expressed in each tissue. C) The log10 ratio of the number of cassette exons differentially included to those differentially excluded.
Figure 3
CLK1 and CLK2 gene (left) and splice event expression (right).
Figure 4
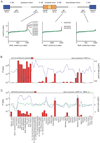
A) Identification of alternative splicing motifs enriched in eight regions adjacent cassette exons upregulated in skeletal muscle. Abbreviations: exon5 (exon3), 5' (3') portion of cassette exons; uif (dif), intronic fraction upstream (downstream); uexon3 (dexon5) and udif (duif) are the corresponding regions adjacent the upstream (downstream) exons. Sorted pentamer and hexamer enrichment in three exemplary regions are shown. Green points are −log10 p-values; magenta points are those with a Bonferroni-corrected p-value less than 0.01. Positive (negative) p-values indicate motif enrichment (depletion). The black line represents the average of 200 randomized runs. B) Enrichment of UCUCU in human tissues and cell lines. Left axis: enrichment of UCUCU in the 200 nt upstream of upregulated cassette exons. Right axis: gene expression of PTBP1. C) Enrichment of UGCAUG. Left axis: enrichment of UGCAUG in the 200 nt downstream of upregulated cassette exons. Right axis: gene expressions of Fox proteins A2BP1 and RBM9. Displayed p-values are not Bonferroni corrected.
Figure 5
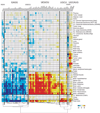
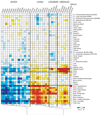
Motif enrichment upstream of cassette exons upregulated in human tissues and cell lines. Values (−log10 e-value) are positive for enrichment and negative for depletion. Motifs and tissues are clustered using agglomerative clustering of the enrichment values.
Figure 6
Motif enrichment downstream of cassette exons upregulated in human tissues and cell lines. Values (−log10 e-value) are positive for enrichment and negative for depletion. Motifs and tissues are clustered using agglomerative clustering of the enrichment values.
Figure 7
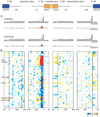
Higher resolution enrichment of UGCAUG adjacent heart regulated cassette exons. Middle: smoothed fraction of the cassette exons with UGCAUG. Red, heart upregulated cassette exons; blue, heart downregulated; green, all monitored exons; filled gray regions, RefSeq exons. Bottom: hypergeometric probability (−log10 p-value) for up- and downregulated exons relative to all monitored exons.
Figure 8
Higher resolution enrichment of UCUCU adjacent regulated cassette exons. A) Smoothed fraction of the cassette exons with UGCAUG in cerebellum (upper) and fetal kidney (lower). Red, upregulated cassette exons; blue, downregulated; green, all monitored exons; filled gray regions, RefSeq exons. Maximum significance in cerebellum/uif is p-value < 1e-22; maximum proportion is 52. B) Hypergeometric probability (−log10 p-value) for up- and down-regulated exons relative to all monitored exons. At each point, the most significant p-value associated with either up or down regulated exons is shown. Samples are ordered alphabetically as per Figure 5.
Similar articles
- A correlation with exon expression approach to identify cis-regulatory elements for tissue-specific alternative splicing.
Das D, Clark TA, Schweitzer A, Yamamoto M, Marr H, Arribere J, Minovitsky S, Poliakov A, Dubchak I, Blume JE, Conboy JG. Das D, et al. Nucleic Acids Res. 2007;35(14):4845-57. doi: 10.1093/nar/gkm485. Epub 2007 Jul 10. Nucleic Acids Res. 2007. PMID: 17626050 Free PMC article. - Unusual intron conservation near tissue-regulated exons found by splicing microarrays.
Sugnet CW, Srinivasan K, Clark TA, O'Brien G, Cline MS, Wang H, Williams A, Kulp D, Blume JE, Haussler D, Ares M Jr. Sugnet CW, et al. PLoS Comput Biol. 2006 Jan;2(1):e4. doi: 10.1371/journal.pcbi.0020004. Epub 2006 Jan 20. PLoS Comput Biol. 2006. PMID: 16424921 Free PMC article. - Global regulatory features of alternative splicing across tissues and within the nervous system of C. elegans.
Koterniak B, Pilaka PP, Gracida X, Schneider LM, Pritišanac I, Zhang Y, Calarco JA. Koterniak B, et al. Genome Res. 2020 Dec;30(12):1766-1780. doi: 10.1101/gr.267328.120. Epub 2020 Oct 30. Genome Res. 2020. PMID: 33127752 Free PMC article. - The Muscleblind family of proteins: an emerging class of regulators of developmentally programmed alternative splicing.
Pascual M, Vicente M, Monferrer L, Artero R. Pascual M, et al. Differentiation. 2006 Mar;74(2-3):65-80. doi: 10.1111/j.1432-0436.2006.00060.x. Differentiation. 2006. PMID: 16533306 Review. - Role of viral splicing elements and cellular RNA binding proteins in regulation of HIV-1 alternative RNA splicing.
Stoltzfus CM, Madsen JM. Stoltzfus CM, et al. Curr HIV Res. 2006 Jan;4(1):43-55. doi: 10.2174/157016206775197655. Curr HIV Res. 2006. PMID: 16454710 Review.
Cited by
- Dynamic motions of the HIV-1 frameshift site RNA.
Mouzakis KD, Dethoff EA, Tonelli M, Al-Hashimi H, Butcher SE. Mouzakis KD, et al. Biophys J. 2015 Feb 3;108(3):644-54. doi: 10.1016/j.bpj.2014.12.006. Biophys J. 2015. PMID: 25650931 Free PMC article. - The Role of Alternative Splicing Factors hnRNP G and Fox-2 in the Progression and Prognosis of Esophageal Cancer.
Zheng Y, Niu X, Xue W, Li L, Geng Q, Fan Z, Zhao J. Zheng Y, et al. Dis Markers. 2022 Nov 23;2022:3043737. doi: 10.1155/2022/3043737. eCollection 2022. Dis Markers. 2022. PMID: 36466711 Free PMC article. - A copy number variation in human NCF1 and its pseudogenes.
Brunson T, Wang Q, Chambers I, Song Q. Brunson T, et al. BMC Genet. 2010 Feb 23;11:13. doi: 10.1186/1471-2156-11-13. BMC Genet. 2010. PMID: 20178640 Free PMC article. - Integrative modeling defines the Nova splicing-regulatory network and its combinatorial controls.
Zhang C, Frias MA, Mele A, Ruggiu M, Eom T, Marney CB, Wang H, Licatalosi DD, Fak JJ, Darnell RB. Zhang C, et al. Science. 2010 Jul 23;329(5990):439-43. doi: 10.1126/science.1191150. Epub 2010 Jun 17. Science. 2010. PMID: 20558669 Free PMC article. - A statistical method for the detection of alternative splicing using RNA-seq.
Wang L, Xi Y, Yu J, Dong L, Yen L, Li W. Wang L, et al. PLoS One. 2010 Jan 8;5(1):e8529. doi: 10.1371/journal.pone.0008529. PLoS One. 2010. PMID: 20072613 Free PMC article.
References
- Johnson JM, et al. Genome-wide survey of human alternative pre-mRNA splicing with exon junction microarrays. Science. 2003;302:2141–2144. - PubMed
- Kwan T, et al. Genome-wide analysis of transcript isoform variation in humans. Nat Genet. 2008;40:225–231. - PubMed
- Singh R, Valcarcel J, Green MR. Distinct binding specificities and functions of higher eukaryotic polypyrimidine tract-binding proteins. Science. 1995;268:1173–1176. - PubMed
Publication types
MeSH terms
Grants and funding
- R01 GM076493/GM/NIGMS NIH HHS/United States
- R01 GM076493/GM/NIGMS NIH HHS/United States
- R01 AR045653/AR/NIAMS NIH HHS/United States
- R01 GM074688/GM/NIGMS NIH HHS/United States
- R01 GM084198/GM/NIGMS NIH HHS/United States
LinkOut - more resources
Full Text Sources
Other Literature Sources
Molecular Biology Databases
Miscellaneous
