CD8+ CD205+ splenic dendritic cells are specialized to induce Foxp3+ regulatory T cells - PubMed (original) (raw)
CD8+ CD205+ splenic dendritic cells are specialized to induce Foxp3+ regulatory T cells
Sayuri Yamazaki et al. J Immunol. 2008.
Abstract
Foxp3(+)CD25(+)CD4(+) regulatory T cells (Treg) mediate immunological self-tolerance and suppress immune responses. A subset of dendritic cells (DCs) in the intestine is specialized to induce Treg in a TGF-beta- and retinoic acid-dependent manner to allow for oral tolerance. In this study we compare two major DC subsets from mouse spleen. We find that CD8(+) DEC-205/CD205(+) DCs, but not the major fraction of CD8(-) DC inhibitory receptor-2 (DCIR2)(+) DCs, induce functional Foxp3(+) Treg from Foxp3(-) precursors in the presence of low doses of Ag but without added TGF-beta. CD8(+)CD205(+) DCs preferentially express TGF-beta, and the induction of Treg by these DCs in vitro is blocked by neutralizing Ab to TGF-beta. In contrast, CD8(-)DCIR2(+) DCs better induce Foxp3(+) Treg when exogenous TGF-beta is supplied. In vivo, CD8(+)CD205(+) DCs likewise preferentially induce Treg from adoptively transferred, Ag-specific DO11.10 RAG(-/-) Foxp3(-)CD4(+) T cells, whereas the CD8(-)DCIR2(+) DCs better stimulate natural Foxp3(+) Treg. These results indicate that a subset of DCs in spleen, a systemic lymphoid organ, is specialized to differentiate peripheral Foxp3(+) Treg, in part through the endogenous formation of TGF-beta. Targeting of Ag to these DCs might be useful for inducing Ag-specific Foxp3(+) Treg for treatment of autoimmune diseases, transplant rejection, and allergy.
Figures
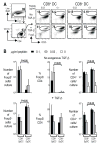
Fig. 1. CD8+ spleen DCs differentiate Foxp3+ CD25+CD4+ T reg from Foxp3− CD25− CD4+ T cells in the absence of exogenous TGF-β in vitro
(A) Freshly isolated Foxp3−CD25−CD4+ T cells from DO11.10 RAG−/− mice (2×10⁴) were cultured with the indicated doses of peptide and CD8− or CD8+ DCs (2×10⁴) in the absence or presence of TGF-β (2 ng/ml). After 5 days of culture, cells were analyzed by FACS. Representative gates of CD4+ CD11c+ cells are shown on the left. (B) As in (A), but the number of Foxp3+ cells, the percentage of Foxp3+ T cells/CD4+ T cells, and the number of CD4+ T cells per culture in the presence or absence of TGF-β are shown. The number of Foxp3+ cells at 0 μg/ml peptide was < 102. A summary of 5–7 separate experiments. P values were provided by student-t test.
Fig. 2. CD8+ DCs differentiate Foxp3+ CD25+ CD4+ T reg using endogenous TGF-β
(A) Freshly isolated Foxp3− CD25− CD4+ T cells from DO11.10 RAG−/− mice (2×10⁴) were cultured with 0.03 μg/ml peptide with CD8+ DCs (2×10⁴) in the presence of anti-TGF-β mAb or isotype matched control mAb (10 μg/ml). After 5 days of culture, cells were analyzed with FACS by gating on CD4+ CD11c− T cells. (B) As in (A), but the number of Foxp3+ cells, the percentage of Foxp3+ T cells/CD4+ T cells, and the number of CD4+ T cells per culture are shown. A summary of 3 separate experiments. P values were provided by student-t test. (C) As in (A), but cells were cultured in the presence of anti-IL-10 mAb or isotype control mAb (10 μg/ml). After 5 days of culture, cells were analyzed with FACS by gating on CD4+ CD11c− T cells. (D) As in (C), but the number of Foxp3+ cells, the percentage of Foxp3+ T cells/CD4+ T cells, and the number of CD4+ T cells per culture are shown. These data are representative of 3 experiments.
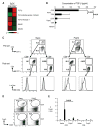
Fig. 3. CD8+ DCs produce TGF-β
(A) Total RNA was isolated from splenic CD8+ DEC-205+ or CD8− DCIR2+ DCs. Affymetrix gene array analysis showing relative levels of mRNAs associated with the TGF-β and TGF-β receptor signaling pathways expressed by CD8− DCIR2+ (left panel) and CD8+ DEC-205+ DCs (right panel) purified from B6 mice. Each lane consists of three independent microarrays of mRNAs from different cell sorts. (B) CD8+ or CD8− DCs from naïve BALB/c mice or BALB/c mice that had been injected with poly IC 12 hours before were cultured for 15–40 hours in serum free medium and the concentrations of TGF-β in the supernatants were measured by ELISA. The concentration of TGF-β in the serum free medium was 0. A summary of 5 separate experiments. P value was provided by student-t test. (C) CD8+ or CD8− DCs from naïve BALB/c mice or BALB/c mice that had been injected with poly IC 12 hours before were purified by flow cytometry. Pre-sort (top) and post-sort (middle) plots are shown as gated on CD11c+ cells. The purified cells were further stained with CD86 (black line) and isotype control Abs (shaded gray line) (bottom). (D) The purified CD8+ or CD8−DCs (2×10⁴) from naïve or poly IC injected mice as in (C) were cultured with freshly isolated Foxp3− CD25− CD4+ T cells from DO11.10 RAG−/− mice (2×10⁴) in the presence of 0.03 μg/ml peptide. After 5 days of culture, cells were analyzed with FACS by gating on CD4+ CD11c− T cells. (E) As in (D), but the frequency of Foxp3+ T cells/CD4+ T cells per culture is also shown. These data are representative of 3 independent experiments with each experiment done in triplicate. P value was provided by student-t test.
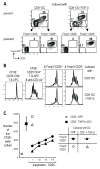
Fig. 4. Suppressive function of Foxp3+ CD25+ CD4+ T reginduced by CD8+ or CD8−DCs
(A) Foxp3− CD25− CD4+ T cells (2×10⁴) from FIR-OTII mice were cultured with spleen CD8+ DCs (2×10⁴) in the presence of peptide (0.03–0.1 μg/ml) without TGF-β. After 5–6 days, the induced Foxp3+ CD25+ CD4+ T reg and Foxp3− CD25− CD4+ T cells were purified by flow cytometry. Similarly, Foxp3− CD25− CD4+ T cells from FIR-OTII mice were also cultured with spleen CD8− DCs in the presence of peptide (0.03–0.1 μg/ml) with TGF-β (2 ng/ml), and the induced Foxp3+ CD25+ CD4+ T reg were purified by flow cytometery. The square in pre-sort indicates the gate for sorting. The purity of sorted cells is also shown (post-sort). (B) For the suppression assay, CD25− CD4+ responder T cells (1×10⁴) from B6 mice were CFSE-labeled and stimulated with spleen APCs (5×10⁴) and anti-CD3 mAb. To these, the suppressors (1×10⁴) as above were added. After 3 days, CFSE-dilution was analyzed by flow cytometry. Dead cells were gated out by TOPRO-3 iodide. These data are representative of 3 independent experiments. (C) As in (B), but the number of live CFSE+ CD25−CD4+ responder cells per culture was shown. The indicated suppressors were added in the culture at the indicated ratio. This data is representative of 2 independent experiments.
Fig. 5. T reg proliferate during differentiation by DC subsets
Foxp3− CD25−CD4+ T cells from DO11.10 RAG−/− mice (2×10⁴) were CFSE labeled and cultured with CD8+ DCs (2×10⁴) without TGF-β (2 ng/ml) or CD8− DCs (2×10⁴) with TGF-β in the presence or absence of OVA peptide (0.03 μg/ml). At day 5, cells were stained with anti-Foxp3 mAb. Foxp3 expression and CFSE dilution are shown gated on live CD11c− CD4+ T cells. This data is representative of 3 independent experiments.
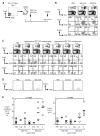
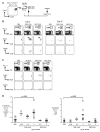
Fig. 6. DC targeting of OVA via DEC-205 leads to the development of Foxp3+ CD25+ CD4+ T cells in vivo
(A) Thy1.2+ DO11.10 RAG−/− mice lack Foxp3+ CD25+ CD4+ T cells as shown in the plots. The Foxp3− CD25− CD4+ T cells were CFSE-labeled (2×10⁶) and injected i.v. into Thy1.1+ BALB/c mice. The recipients were stimulated with indicated doses of DEC-OVA or 33D1-OVA i.p. one day later. After 3 or 10–14 days, spleen and lymph node Thy1.2+ cells were analyzed by FACS. (B) As in (A), but the frequencies of donor Thy1.2+ DO11.10 RAG−/−CD4+ T cells within gates at day 3 are shown in the top row. Foxp3, isotype control staining and CFSE dilution gated on Thy1.2+ transferred DO11.10 RAG−/−CD4+ T cells are shown in the middle and bottom rows. This data is representative of 2 independent experiments. (C) As in (A), but the frequencies of donor Thy1.2+ DO11.10 RAG−/− CD4+ T cells within gates at day 13 are shown in the top row. Foxp3, isotype control staining and CFSE dilution gated on the Thy1.2+ transferred DO11.10 RAG−/−CD4+ T cells are shown in the middle and bottom rows. (D) As in (A), but recipient mice were stimulated with PBS, 3 μg DEC-OVA or Iso-OVA i.p. one day later. After 13 days, a mixture of spleen and lymph nodes was analyzed by FACS. Foxp3 (left), isotype control staining (right) and CFSE dilution gated on the Thy1.2+ transferred DO11.10 RAG−/−CD4+ T cells are shown. Data are representative of 3 independent experiments. (E) Cell recoveries of Foxp3+ Thy1.2+ T cells from transferred DO11.10 RAG−/− CD4+ T cells at day10–14 are shown as percentages per Thy1.2+ T cells (left) and absolute numbers from each mouse (right). A summary of 5 separate experiments where each data point is a separate experiment. P value is from student t-test.
Fig. 7. DC targeting of OVA via 33D1 better sustains naturally occurring Foxp3+ CD25+CD4+ T cells in vivo
(A) CD25+ CD4+ Foxp3+ T cells from Thy1.2+ DO11.10 transgenic mice were cultured with mature DCs, peptide and IL-2. After 7 days, the expanded T reg were > 90% CD25+Foxp3+. The expanded T reg (0.5~1×10⁶) were CFSE-labeled and adoptively transferred into Thy1.1+ BALB/c mice. One day later, the mice were i.p. injected with 3 μg of 33D1-OVA, DEC-OVA Abs or PBS. Spleen and lymph node cells were mixed and analyzed by FACS at day 3 or 14. (B) Mixtures of spleen and lymph node cells at day 3 or 10 after injection of 33D1-OVA, DEC-OVA Abs or PBS were stained with anti-CD4 and anti-Thy1.2 (Top). Foxp3, isotype control staining and CFSE dilution gated on Thy1.2+ transferred DO11.10 T reg are shown in the middle and bottom rows. (C) As in (A), but freshly isolated CFSE-labeled Thy1.2 DO11.10 CD25+ CD4+ T reg were transferred into Thy1.1+ BALB/c mice. One day later, the mice were i.p. injected with 3 μg of 33D1-OVA, DEC-OVA Abs, Iso-OVA or PBS. Spleen and lymph node cells were mixed and analyzed FACS at day 3. Data are representative of 2 independent experiments (D) As in (A), but cell recovery of Thy1.2+ transferred DO11.10 T reg at day 10–14 is shown. A summary of 5 separate experiments. P value is from student t-test.
Similar articles
- Targeting DEC-205-DCIR2+ dendritic cells promotes immunological tolerance in proteolipid protein-induced experimental autoimmune encephalomyelitis.
Tabansky I, Keskin DB, Watts D, Petzold C, Funaro M, Sands W, Wright P, Yunis EJ, Najjar S, Diamond B, Cao Y, Mooney D, Kretschmer K, Stern JNH. Tabansky I, et al. Mol Med. 2018 May 3;24(1):17. doi: 10.1186/s10020-018-0017-6. Mol Med. 2018. PMID: 30134798 Free PMC article. - Tolerogenic dendritic cells induce CD4+CD25hiFoxp3+ regulatory T cell differentiation from CD4+CD25-/loFoxp3- effector T cells.
Huang H, Dawicki W, Zhang X, Town J, Gordon JR. Huang H, et al. J Immunol. 2010 Nov 1;185(9):5003-10. doi: 10.4049/jimmunol.0903446. Epub 2010 Sep 24. J Immunol. 2010. PMID: 20870943 - Transforming growth factor-beta and all-trans retinoic acid generate ex vivo transgenic regulatory T cells with intestinal homing receptors.
Moore C, Sauma D, Morales J, Bono MR, Rosemblatt M, Fierro JA. Moore C, et al. Transplant Proc. 2009 Jul-Aug;41(6):2670-2. doi: 10.1016/j.transproceed.2009.06.130. Transplant Proc. 2009. PMID: 19715998 - Dendritic cells as controllers of antigen-specific Foxp3+ regulatory T cells.
Yamazaki S, Steinman RM. Yamazaki S, et al. J Dermatol Sci. 2009 May;54(2):69-75. doi: 10.1016/j.jdermsci.2009.02.001. Epub 2009 Mar 14. J Dermatol Sci. 2009. PMID: 19286352 Free PMC article. Review. - TGF-β Control of Adaptive Immune Tolerance: A Break From Treg Cells.
Liu M, Li S, Li MO. Liu M, et al. Bioessays. 2018 Nov;40(11):e1800063. doi: 10.1002/bies.201800063. Epub 2018 Aug 29. Bioessays. 2018. PMID: 30159904 Free PMC article. Review.
Cited by
- Striking a balance: new perspectives on homeostatic dendritic cell maturation.
Bosteels V, Janssens S. Bosteels V, et al. Nat Rev Immunol. 2024 Sep 17. doi: 10.1038/s41577-024-01079-5. Online ahead of print. Nat Rev Immunol. 2024. PMID: 39289483 Review. - Antigen-specific T cell responses in autoimmune diabetes.
Dwyer AJ, Shaheen ZR, Fife BT. Dwyer AJ, et al. Front Immunol. 2024 Aug 15;15:1440045. doi: 10.3389/fimmu.2024.1440045. eCollection 2024. Front Immunol. 2024. PMID: 39211046 Free PMC article. Review. - invariant Natural Killer T cell therapy as a novel therapeutic approach in hematological malignancies.
Boonchalermvichian C, Yan H, Gupta B, Rubin A, Baker J, Negrin RS. Boonchalermvichian C, et al. Front Transplant. 2024 May 6;3:1353803. doi: 10.3389/frtra.2024.1353803. eCollection 2024. Front Transplant. 2024. PMID: 38993780 Free PMC article. Review. - Role of Regulatory T Cells in Intracerebral Hemorrhage.
Shang Y, Zheng L, Du Y, Shang T, Liu X, Zou W. Shang Y, et al. Mol Neurobiol. 2024 Jun 14. doi: 10.1007/s12035-024-04281-7. Online ahead of print. Mol Neurobiol. 2024. PMID: 38877366 Review. - Efferocytosis in dendritic cells: an overlooked immunoregulatory process.
Ma Y, Jiang T, Zhu X, Xu Y, Wan K, Zhang T, Xie M. Ma Y, et al. Front Immunol. 2024 May 21;15:1415573. doi: 10.3389/fimmu.2024.1415573. eCollection 2024. Front Immunol. 2024. PMID: 38835772 Free PMC article. Review.
References
- Sakaguchi S. Naturally arising CD4+ regulatory T cells for immunologic self-tolerance and negative control of immune responses. Annu Rev Immunol. 2004;22:531–562. - PubMed
- Zheng SG, Wang JH, Stohl W, Kim KS, Gray JD, Horwitz DA. TGF-β requires CTLA-4 early after T cell activation to induce FoxP3 and generate adaptive CD4+CD25+ regulatory cells. J Immunol. 2006;176:3321–3329. - PubMed
- Weber SE, Harbertson J, Godebu E, Mros GA, Padrick RC, Carson BD, Ziegler SF, Bradley LM. Adaptive islet-specific regulatory CD4 T cells control autoimmune diabetes and mediate the disappearance of pathogenic Th1 cells in vivo. J Immunol. 2006;176:4730–4739. - PubMed
Publication types
MeSH terms
Substances
Grants and funding
- P01 AI051573-069001/AI/NIAID NIH HHS/United States
- P01 AI051573-010001/AI/NIAID NIH HHS/United States
- P01 AI051573-029001/AI/NIAID NIH HHS/United States
- P01 AI051573-060005/AI/NIAID NIH HHS/United States
- P01 AI051573/AI/NIAID NIH HHS/United States
- P01 AI051573-040001/AI/NIAID NIH HHS/United States
- AI 051573/AI/NIAID NIH HHS/United States
- P01 AI051573-039001/AI/NIAID NIH HHS/United States
- P01 AI051573-079001/AI/NIAID NIH HHS/United States
- P01 AI051573-070005/AI/NIAID NIH HHS/United States
- P01 AI051573-019001/AI/NIAID NIH HHS/United States
- P01 AI051573-020001/AI/NIAID NIH HHS/United States
- P01 AI051573-059001/AI/NIAID NIH HHS/United States
- P01 AI051573-030001/AI/NIAID NIH HHS/United States
- P01 AI051573-050001/AI/NIAID NIH HHS/United States
- P01 AI051573-049001/AI/NIAID NIH HHS/United States
LinkOut - more resources
Full Text Sources
Other Literature Sources
Research Materials
