Network hubs buffer environmental variation in Saccharomyces cerevisiae - PubMed (original) (raw)
Network hubs buffer environmental variation in Saccharomyces cerevisiae
Sasha F Levy et al. PLoS Biol. 2008.
Abstract
Regulatory and developmental systems produce phenotypes that are robust to environmental and genetic variation. A gene product that normally contributes to this robustness is termed a phenotypic capacitor. When a phenotypic capacitor fails, for example when challenged by a harsh environment or mutation, the system becomes less robust and thus produces greater phenotypic variation. A functional phenotypic capacitor provides a mechanism by which hidden polymorphism can accumulate, whereas its failure provides a mechanism by which evolutionary change might be promoted. The primary example to date of a phenotypic capacitor is Hsp90, a molecular chaperone that targets a large set of signal transduction proteins. In both Drosophila and Arabidopsis, compromised Hsp90 function results in pleiotropic phenotypic effects dependent on the underlying genotype. For some traits, Hsp90 also appears to buffer stochastic variation, yet the relationship between environmental and genetic buffering remains an important unresolved question. We previously used simulations of knockout mutations in transcriptional networks to predict that many gene products would act as phenotypic capacitors. To test this prediction, we use high-throughput morphological phenotyping of individual yeast cells from single-gene deletion strains to identify gene products that buffer environmental variation in Saccharomyces cerevisiae. We find more than 300 gene products that, when absent, increase morphological variation. Overrepresented among these capacitors are gene products that control chromosome organization and DNA integrity, RNA elongation, protein modification, cell cycle, and response to stimuli such as stress. Capacitors have a high number of synthetic-lethal interactions but knockouts of these genes do not tend to cause severe decreases in growth rate. Each capacitor can be classified based on whether or not it is encoded by a gene with a paralog in the genome. Capacitors with a duplicate are highly connected in the protein-protein interaction network and show considerable divergence in expression from their paralogs. In contrast, capacitors encoded by singleton genes are part of highly interconnected protein clusters whose other members also tend to affect phenotypic variability or fitness. These results suggest that buffering and release of variation is a widespread phenomenon that is caused by incomplete functional redundancy at multiple levels in the genetic architecture.
Conflict of interest statement
Competing interests. The authors have declared that no competing interests exist.
Figures
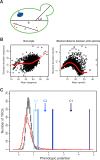
Figure 1. Genome-Wide Screen for Phenotypic Capacitors in S. cerevisiae
(A) Schematic of some quantitative phenotypes in a budded cell: (a) long axis length of the mother nucleus, (b) long axis length in the mother cell, (c) maximal distance between actin patches, (d) bud angle. A full list of phenotypes and their descriptions is reported in Ohya et al. [17]. (B) Scatter plots of means and standard deviations for 4,718 YKO strains for two phenotypes clearly indicate that variance depends on mean in a nontrivial, phenotype-specific manner. Black circles represent individual YKOs and red circles represent the lowess curve fit. (C) Histograms of actual (red) and 100 randomized (grey) phenotypic potential scores. Shown are the ranges of the three phenotypic capacitor classes (C1, C2, C3).
Figure 2. Phenotypic Capacitor YKOs Have Highly Variable and Distinct Phenotypes
Representative micrographs from examples of putative phenotypic capacitor (HPR1, KEM1, SWI6, BEM2, CLA4, DIA2, RAD52) and control (YDR279W and YCR100C) strains are shown. Cells are stained with FITC-concanavalin A (green), rhodamine phalloidin (red), and DAPI (blue). Lower right: Histograms of the phenotypic potentials of control (black) and phenotypic capacitor (red) YKOs of haploid-converted heterozygous diploid strains.
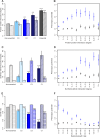
Figure 3. Network and Dispensability Characteristics of Phenotypic Capacitors
(A) The average number of physical interactions of high (C1, dark blue), mid (C2, blue), and low (C3, light blue) confidence phenotypic capacitors versus all nonessential (light grey) or essential (dark grey) genes using all physical interactions in the literature-curated network of the BioGRID (solid bars) or only affinity-capture mass spectrometry interactions (diagonal stripes). (B) The average phenotypic potential of all nonessential genes (blue squares) or nonessential genes that have not been classified as a phenotypic capacitor (black triangles) binned by their number of affinity-capture mass spectrometry PPIs. (C) The average number of SLIs using all interactions annotated in the literature curated BioGRID network (solid bars), interactions derived only from SGA experiments considering only genes used as bait (diagonal stripes), and interactions derived only from SGA experiments considering only genes not used as bait (horizontal stripes). (D) The average phenotypic potential of all nonessential (blue squares) or nonessential noncapacitor (black triangles) genes binned by their number of literature-citation SLIs. (E) The average growth rates for haploid KO (solid bars), heterozygous diploid KO (diagonal stripes), and homozygous diploid KO (horizontal stripes) strains. Values are relative to wild type. (F) The average phenotypic potential of all nonessential (blue squares) or nonessential noncapacitor (black triangles) genes binned by their haploid growth rates. Error bars represent the standard error of the mean. All _p_-values are a comparison to nonessential genes, Wilcoxon-Mann-Whitney test: *, p < 0.05; **, p < 0.001; ***, p < 1 × 10⁻⁵; ****, p < 1 × 10⁻¹⁰.
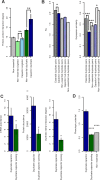
Figure 4. Characteristics of Capacitor Duplicates
(A) The average number of affinity-capture mass spectrometry interactions of all nonessential genes (grey), all nonessential singletons (light green), capacitor singletons (light blue), all nonessential duplicates (dark green), and capacitor duplicates (dark blue). (B) Ks (left) and the expression similarity (right) between duplicate pairs that contain at least one essential gene (dark grey), at least one capacitor (solid dark blue), only nonessential noncapacitor genes (solid light grey), at least one gene product with over 19 PPIs annotated in the literature-curated BioGRID network and at least one capacitor (dark blue stripes), and at least one gene product with over 19 PPIs and no capacitors or essential genes (light grey stripes). (C) The mRNA abundance (left), protein abundance (middle), and SLI degree (right) of capacitors with only one paralog in the genome (blue) and their paralogs (green). (D) The phenotypic potential of capacitors with only one paralog in the genome (blue), their paralogs (green), and all nonessential genes (grey). Error bars represent the standard error of the mean. Unless otherwise marked, _p_-values are a comparison to duplicate capacitors, Wilcoxon-Mann-Whitney test: *, p < 0.05; **, p < 0.001; ***, p < 1 × 10⁻⁵; ****, p < 1 × 10⁻¹⁰.
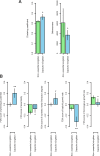
Figure 5. Network characteristics of capacitor singletons
(A) The clustering coefficient (left) and betweenness centrality (right) of all nonessential singletons (light green) and capacitor singletons (light blue). (B) Properties of the immediate PPI neighbors of a gene controlled for the degree of that gene (FDN score, see methods) for all nonessential singletons (light green) and capacitor singletons (light blue). From left to right: the phenotypic potential, the number of essential genes, the fraction of SLIs in the literature-curated BioGRID network, the haploid growth rate when deleted, the diploid growth rate when both copies are deleted. Error bars represent the standard error of the mean. Wilcoxon-Mann-Whitney test: *, p < 0.05; **, p < 0.01.
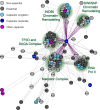
Figure 6. Singleton and duplicate capacitors occupy different locations in the PPI network
The differences between singleton and duplicate capacitors are illustrated by the protein-interaction subnetwork surrounding complexes involved in transcriptional activation. Shown is a subnetwork of the affinity-capture mass spectrometry interaction network that was created using all proteins annotated to be in the Mediator complex and their first-degree interaction neighbors. The subnetwork was displayed using Cytoscape (
), with nodes placed by spring embedded layout. Nineteen nodes with only one interaction have been removed for clarity. Colors represent nonessential proteins (light grey), essential proteins (dark grey), singleton capacitors (light blue), duplicate capacitors (dark blue), and capacitors that cannot be categorized as singletons or duplicates (purple). Singleton capacitors are likely to be found in highly interconnected complexes such as the Mediator transcriptional coactivation complex, RNA polymerase II, the SAGA and TFIID complexes, and chromatin remodeling complexes. Other members of these complexes tend to be essential genes or capacitors. Duplicate capacitors are highly connected and tend to interact with multiple complexes. Interactions of the duplicate capacitor TAF14 are highlighted in purple.
Similar articles
- Evolutionary capacitance as a general feature of complex gene networks.
Bergman A, Siegal ML. Bergman A, et al. Nature. 2003 Jul 31;424(6948):549-52. doi: 10.1038/nature01765. Nature. 2003. PMID: 12891357 - It's not magic - Hsp90 and its effects on genetic and epigenetic variation.
Zabinsky RA, Mason GA, Queitsch C, Jarosz DF. Zabinsky RA, et al. Semin Cell Dev Biol. 2019 Apr;88:21-35. doi: 10.1016/j.semcdb.2018.05.015. Epub 2018 Jun 6. Semin Cell Dev Biol. 2019. PMID: 29807130 Free PMC article. Review. - A gene's ability to buffer variation is predicted by its fitness contribution and genetic interactions.
Wang GZ, Liu J, Wang W, Zhang HY, Lercher MJ. Wang GZ, et al. PLoS One. 2011 Mar 2;6(3):e17650. doi: 10.1371/journal.pone.0017650. PLoS One. 2011. PMID: 21407817 Free PMC article. - Robustness and evolvability in natural chemical resistance: identification of novel systems properties, biochemical mechanisms and regulatory interactions.
Venancio TM, Balaji S, Geetha S, Aravind L. Venancio TM, et al. Mol Biosyst. 2010 Aug;6(8):1475-91. doi: 10.1039/c002567b. Epub 2010 Jun 2. Mol Biosyst. 2010. PMID: 20517567 Free PMC article. - The Hsp90 capacitor, developmental remodeling, and evolution: the robustness of gene networks and the curious evolvability of metamorphosis.
Rutherford S, Hirate Y, Swalla BJ. Rutherford S, et al. Crit Rev Biochem Mol Biol. 2007 Sep-Oct;42(5):355-72. doi: 10.1080/10409230701597782. Crit Rev Biochem Mol Biol. 2007. PMID: 17917872 Review.
Cited by
- A large accessory protein interactome is rewired across environments.
Liu Z, Miller D, Li F, Liu X, Levy SF. Liu Z, et al. Elife. 2020 Sep 14;9:e62365. doi: 10.7554/eLife.62365. Elife. 2020. PMID: 32924934 Free PMC article. - The details in the distributions: why and how to study phenotypic variability.
Geiler-Samerotte KA, Bauer CR, Li S, Ziv N, Gresham D, Siegal ML. Geiler-Samerotte KA, et al. Curr Opin Biotechnol. 2013 Aug;24(4):752-9. doi: 10.1016/j.copbio.2013.03.010. Epub 2013 Apr 6. Curr Opin Biotechnol. 2013. PMID: 23566377 Free PMC article. - Exploiting Single-Cell Quantitative Data to Map Genetic Variants Having Probabilistic Effects.
Chuffart F, Richard M, Jost D, Burny C, Duplus-Bottin H, Ohya Y, Yvert G. Chuffart F, et al. PLoS Genet. 2016 Aug 1;12(8):e1006213. doi: 10.1371/journal.pgen.1006213. eCollection 2016 Aug. PLoS Genet. 2016. PMID: 27479122 Free PMC article. - Developmental biomarkers of aging in Caenorhabditis elegans.
Pincus Z, Slack FJ. Pincus Z, et al. Dev Dyn. 2010 May;239(5):1306-14. doi: 10.1002/dvdy.22224. Dev Dyn. 2010. PMID: 20151474 Free PMC article. Review. - Canalization of Phenotypes-When the Transcriptome is Constantly but Weakly Perturbed.
Lu GA, Zhang J, Zhao Y, Chen Q, Lin P, Tang T, Tang Z, Wen H, Liufu Z, Wu CI. Lu GA, et al. Mol Biol Evol. 2023 Jan 4;40(1):msad005. doi: 10.1093/molbev/msad005. Mol Biol Evol. 2023. PMID: 36617265 Free PMC article.
References
- Wagner A. Robustness and evolvability in living systems. Princeton (New Jersey): Princeton University Press; 2005.
- Waddington CH. Canalization of development and the inheritance of acquired characteristics. Nature. 1942;150:563–565.
- Siegal ML, Bergman A. Canalization. In: Fox CW, Wolf JB, editors. Evolutionary genetics: concepts and case studies. New York: Oxford University Press; 2006. pp. 235–251.
- Hansen TF. The evolution of genetic architecture. Annu Rev Ecol Evol Syst. 2006;37:123–157.
- Wagner A. Robustness, evolvability, and neutrality. FEBS Lett. 2005;579:1772–1778. - PubMed
Publication types
MeSH terms
Substances
LinkOut - more resources
Full Text Sources
Other Literature Sources
Molecular Biology Databases
