Midbrain dopaminergic neurons and striatal cholinergic interneurons encode the difference between reward and aversive events at different epochs of probabilistic classical conditioning trials - PubMed (original) (raw)
Midbrain dopaminergic neurons and striatal cholinergic interneurons encode the difference between reward and aversive events at different epochs of probabilistic classical conditioning trials
Mati Joshua et al. J Neurosci. 2008.
Abstract
Midbrain dopaminergic neurons (DANs) typically increase their discharge rate in response to appetitive predictive cues and outcomes, whereas striatal cholinergic tonically active interneurons (TANs) decrease their rate. This may indicate that the activity of TANs and DANs is negatively correlated and that TANs can broaden the basal ganglia reinforcement teaching signal, for instance by encoding worse than predicted events. We studied the activity of 106 DANs and 180 TANs of two monkeys recorded during the performance of a classical conditioning task with cues predicting the probability of food, neutral, and air puff outcomes. DANs responded to all cues with elevations of discharge rate, whereas TANs depressed their discharge rate. Nevertheless, although dopaminergic responses to appetitive cues were larger than their responses to neutral or aversive cues, the TAN responses were more similar. Both TANs and DANs responded faster to an air puff than to a food outcome; however, DANs responded with a discharge elevation, whereas the TAN responses included major negative and positive deflections. Finally, food versus air puff omission was better encoded by TANs. In terms of the activity of single neurons with distinct responses to the different behavioral events, both DANs and TANs were more strongly modulated by reward than by aversive related events and better reflected the probability of reward than aversive outcome. Thus, TANs and DANs encode the task episodes differentially. The DANs encode mainly the cue and outcome delivery, whereas the TANs mainly encode outcome delivery and omission at termination of the behavioral trial episode.
Figures
Figure 1.
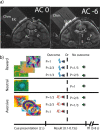
MRI and task. a, MRI identification of recording coordinates. Coronal MRI images numbered with respect to distance (in millimeters) from anterior commissure. Tungsten microelectrodes are inserted at known chamber coordinates. Identification of the brain structures is based on alignment of the MRI images with the monkey atlas. Abbreviations: AC, Anterior commissure; C, caudate; Chm, recording chamber (filled with 3% agar); Elc, electrode; G, globus pallidus; P, putamen; S, substantia nigra; T, thalamus. b, Behavioral task. Top, Reward trials; middle, neutral trials; bottom, aversive trials. Cues are shown for monkey L. Different speaker colors represent different sounds.
Figure 2.
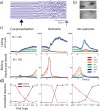
Behavioral monitoring and results. a, Mouth signal: example from the reward cue epoch of the licking signal, monitored by an infrared reflection detector. The black arrow indicates time of cue presentation, and the gray arrow indicates cue offset and reward tone onset. b, Image of monkey's eyes. Video signal was processed and each frame was classified according to the state of the eyes [i.e., open (top) or closed (bottom)]. c, Behavioral results. Top, Licking (average ± SEM) as recorded by an infrared reflection detector directed at the monkey's mouth. The voltage output of the detector was sampled by A/D converter and the _y_-scale is given in arbitrary A/D units. Bottom, Fraction of trials with eyes closed (average ± SEM) as recorded by computerized video processing. Columns correspond to trial epoch (cue; outcome, food or air puff; no outcome, sound only) aligned to event onset (time = 0). Note the overlap of 0.5 s between the start of the outcome and the no-outcome epochs and the last 0.5 s of the cue epoch. Data were averaged for each session and then across sessions (N, number of recording sessions). Color coding of trial types is given at bottom right (A, aversive; N, neutral; R, reward; the number is the outcome probability). d, Normalized behavioral response. Licking (blue) and blinking (red) response (average ± SEM, number of sessions as in c) in a time window around the behavioral event (cue, 500–0 ms before cue end; outcome and no outcome, 0–500 ms after cue end for blinking response and 500–1000 ms for licking response). The responses are normalized between 0 and 1 [i.e., in each epoch a response (X) is transformed by (X − min)/(max − min), where min and max are the minimal and maximal values of the response in this epoch]. Abscissa, Different behavioral conditions (A, aversive; N, neutral; R, reward; the number is the outcome probability).
Figure 3.
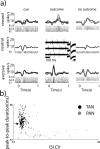
An example of neural activity of a single striatal TAN and identification of striatal cell types. a, Rasters and PSTHs of a single TAN of monkey L aligned to the trial behavioral events. The rows are separated according to the expected outcome. First row, Trials with cues that predict the delivery of food. Second row, Trials with the neutral cue (a cue always followed by no outcome). Third row, Trials with cues that predict an air puff. Columns are aligned according to the trial epoch. First column, Cue presentation epoch (−0.2 to 1 s after cue onset). Second column, Outcome epoch (−0.2 to 1 s after delivery of food or air puff). Third column, Trials in which no outcome was delivered; outcome omission was signaled to the monkey by the no-outcome sound (−0.2 to 1 s after sound onset). Color codes are marked at the left side of the cue rasters (A, aversive; N, neutral; R, reward; the number is the outcome probability). For the graphic presentation, rasters were randomly pruned and adjusted to contain the same number of trials. The total number of trials (before pruning) was 708. PSTHs were constructed by summing activity across trials in 1 ms resolution and then smoothing with a Gaussian window (SD, 20 ms). Examples from three 500 ms segments of the analog signal (from first, second, and last third of the recording session) are shown in the middle plot. Examples of spike waveforms are shown next to the 500 ms analog segment. The spike waveform plot includes 100 superimposed waveforms selected randomly around the time of the corresponding analog trace. Isolation score was 0.98; the fraction of spikes in first 2 ms of the interspike interval (ISI) histogram was 0.00002. b, Off-line analysis of striatal cell identification based on firing pattern (abscissa) and spike peak-to-peak duration (ordinate). Color code: Black, TANs; gray, phasic active neurons (PANs). Off-line analysis of neuron shape and coefficient of variance (CV) of the time of interspike interval shows that striatal neurons are separated into two clusters in which the PANs have a large CV with comparably narrow waveforms and TANs have a small CV with very wide waveforms. The cell in a is plotted in a large black circle and marked with an arrow.
Figure 4.
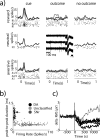
An example of neural activity from a single DAN and identification of substantia nigra cell types. a, Same conventions as in Figure 3_a_. Total number of trials was 271; isolation score was 0.67; fraction of spike in first 2 ms of the ISI histogram was 0.0001. b, Off-line analysis of substantia nigra (SN) cell identification based on firing rate (abscissa) and spike peak-to-peak duration (ordinate). Color code: Black, DANs; gray, substantia nigra pars reticulata (SNr) neurons; light gray, unclassified SN neurons. Off-line analysis of the spike shape and firing rate shows that nigral neurons are separated into two clusters in which the SNr cells have a high firing rate with narrow waveforms and DANs have a low firing rate with wide waveforms. Cells that were not classified as DAN or SNr tended to be between clusters. The cell in a is plotted in a large black circle and marked with an arrow. c, Example of neuronal responses to apomorphine injection in a single recording day. The continuous line is the RMS of the bandpass-filtered analog signal (300–6000 Hz) in bins of 10 s. Color code: Black, Electrodes in which a DAN was identified; dotted gray, electrode with a SNr neuron.
Figure 5.
Percentage of TANs and DANs with significant responses to the different behavioral events. The percentage of neurons with significant responses to the cue, outcome, and no-outcome tone events of the total number of studied neurons (n = 180 TANs and 106 DANs). Color code: Black, TAN; white, DAN. For each epoch, we grouped trials according to trial type (aversive, reward, and neutral). A cell was considered to be significantly modulated in an epoch if at least one of the responses in that epoch was significant.
Figure 6.
TAN and DAN population response at cue epoch. a, Population average response to behavioral cues. Only the first 0.8 s after the cue is shown to highlight the short duration of the responses. Top, TANs (n = 180 neurons). Bottom, DANs (n = 106). Color coding: Dark blue, Responses to high-probability (p = 1 and p = 2/3) reward cues; light blue, reward low (p = 1/3)-probability cues; green, neutral cue; orange, aversive low-probability cues; red, aversive high-probability cues. b, TAN versus DAN population response. The populations and timescale are the same as in a. The population response was considered significant if it passed the significance criteria (t test, p < 0.01) for at least three consecutive 20 ms bins. For this analysis, all trials of the same type (aversive or reward) were grouped. Top, TAN versus DAN in the reward trials. Bottom, TAN versus DAN in the aversive trials. Color coding: Orange, TAN significant bins; white, TAN nonsignificant bins; purple, DAN significant bins; gray, DAN nonsignificant bins.
Figure 7.
TAN and DAN single-cell response at cue epoch. a, Scatter plots comparing the response index of individual neurons to reward and aversive cues. Response index was calculated for each cell (n = 180 TANs and 106 DANs) as the absolute difference between the aversive or reward cue-aligned PSTH and the PSTH of the neutral cue. The black line is the identity (Y = X) line. Points below this line represent cells with a response index that is larger for the reward cues than for aversive cues. Top, TAN. Bottom, DAN. Color code: Blue, Response index significant only for reward cues; red, response index significant only for aversive cues; green, both response indices were significant; gray, neither response index was significant. Significance level was p < 0.05. The time window used for this analysis was 0–1000 ms from cue presentation. Inset, Pie chart of the fraction of cells with a significant index for reward (blue), aversive (red), and both (green) cues of all cells with significant response index (number of responding of total number of cells is given in the text at inset top). b, Scatter plot comparing the probability coding of individual TAN and DAN neurons. The index was calculated as the difference between the grouped response to the high-probability (p = 2/3 and p = 1) and the low-probability (p = 1/3) events. The format and color code are the same as in a. Points below the identity line represent cells with a probability-coding index that is larger for the reward cues than for aversive cues.
Figure 8.
TAN and DAN population response at outcome delivery. a, Population responses at the time of outcome (food or air puff) and the corresponding sounds delivery. b, Comparison between the responses of TANs and DANs. The conventions are the same as in Figure 6.
Figure 9.
TAN and DAN single-cell response at outcome epoch. a, Scatter plots comparing the response index of individual neurons to reward and aversive outcomes. b, Scatter plot comparing the probability-coding index of the single neuron response to reward and aversive outcome. The conventions are the same as in Figure 7.
Figure 10.
TAN and DAN population response at no outcome. a, Population responses in trials with no food or air puff delivery. The same no-outcome tone is given at time = 0. b, Comparison between the responses of TANs and DANs. The conventions are the same as in Figure 6.
Figure 11.
TAN and DAN single-cell response at no outcome. a, Scatter plots comparing the response index of individual neurons in trials in which food and air puff were not delivered. b, Scatter plot comparing the probability-coding index. The conventions are the same as in Figure 7.
Similar articles
- Encoding of probabilistic rewarding and aversive events by pallidal and nigral neurons.
Joshua M, Adler A, Rosin B, Vaadia E, Bergman H. Joshua M, et al. J Neurophysiol. 2009 Feb;101(2):758-72. doi: 10.1152/jn.90764.2008. Epub 2008 Dec 3. J Neurophysiol. 2009. PMID: 19052110 - Role of tonically active neurons in primate caudate in reward-oriented saccadic eye movement.
Shimo Y, Hikosaka O. Shimo Y, et al. J Neurosci. 2001 Oct 1;21(19):7804-14. doi: 10.1523/JNEUROSCI.21-19-07804.2001. J Neurosci. 2001. PMID: 11567071 Free PMC article. - Modulation of Tonically Active Neurons of the Monkey Striatum by Events Carrying Different Force and Reward Information.
Nougaret S, Ravel S. Nougaret S, et al. J Neurosci. 2015 Nov 11;35(45):15214-26. doi: 10.1523/JNEUROSCI.0039-15.2015. J Neurosci. 2015. PMID: 26558790 Free PMC article. - Tonically active neurons in the primate striatum and their role in the processing of information about motivationally relevant events.
Apicella P. Apicella P. Eur J Neurosci. 2002 Dec;16(11):2017-26. doi: 10.1046/j.1460-9568.2002.02262.x. Eur J Neurosci. 2002. PMID: 12473069 Review. - Tonically active neurons in the striatum encode motivational contexts of action.
Kimura M, Yamada H, Matsumoto N. Kimura M, et al. Brain Dev. 2003 Dec;25 Suppl 1:S20-3. doi: 10.1016/s0387-7604(03)90003-9. Brain Dev. 2003. PMID: 14980367 Review.
Cited by
- Potentiation of NMDA receptor-mediated transmission in striatal cholinergic interneurons.
Oswald MJ, Schulz JM, Kelsch W, Oorschot DE, Reynolds JN. Oswald MJ, et al. Front Cell Neurosci. 2015 Apr 9;9:116. doi: 10.3389/fncel.2015.00116. eCollection 2015. Front Cell Neurosci. 2015. PMID: 25914618 Free PMC article. - Reward-Induced Phasic Dopamine Release in the Monkey Ventral Striatum and Putamen.
Yoshimi K, Kumada S, Weitemier A, Jo T, Inoue M. Yoshimi K, et al. PLoS One. 2015 Jun 25;10(6):e0130443. doi: 10.1371/journal.pone.0130443. eCollection 2015. PLoS One. 2015. PMID: 26110516 Free PMC article. - Prefrontal/accumbal catecholamine system processes high motivational salience.
Puglisi-Allegra S, Ventura R. Puglisi-Allegra S, et al. Front Behav Neurosci. 2012 Jun 27;6:31. doi: 10.3389/fnbeh.2012.00031. eCollection 2012. Front Behav Neurosci. 2012. PMID: 22754514 Free PMC article. - Selective serotonin reuptake inhibitor treatment retunes emotional valence in primate ventral striatum.
Pasquereau B, Drui G, Saga Y, Richard A, Millot M, Météreau E, Sgambato V, Tobler PN, Tremblay L. Pasquereau B, et al. Neuropsychopharmacology. 2021 Nov;46(12):2073-2082. doi: 10.1038/s41386-021-00991-x. Epub 2021 Mar 10. Neuropsychopharmacology. 2021. PMID: 33692476 Free PMC article. - Convergent processing of both positive and negative motivational signals by the VTA dopamine neuronal populations.
Wang DV, Tsien JZ. Wang DV, et al. PLoS One. 2011 Feb 15;6(2):e17047. doi: 10.1371/journal.pone.0017047. PLoS One. 2011. PMID: 21347237 Free PMC article.
References
- Aebischer P, Schultz W. The activity of pars compacta neurons of the monkey substantia nigra is depressed by apomorphine. Neurosci Lett. 1984;50:25–29. - PubMed
- Arbuthnott GW, Wickens J. Space, time and dopamine. Trends Neurosci. 2007;30:62–69. - PubMed
- Bar-Gad I, Bergman H. Stepping out of the box: information processing in the neural networks of the basal ganglia. Curr Opin Neurobiol. 2001;11:689–695. - PubMed
Publication types
MeSH terms
Substances
LinkOut - more resources
Full Text Sources
Other Literature Sources


