Distinct modes of regulation by chromatin encoded through nucleosome positioning signals - PubMed (original) (raw)
Distinct modes of regulation by chromatin encoded through nucleosome positioning signals
Yair Field et al. PLoS Comput Biol. 2008 Nov.
Abstract
The detailed positions of nucleosomes profoundly impact gene regulation and are partly encoded by the genomic DNA sequence. However, less is known about the functional consequences of this encoding. Here, we address this question using a genome-wide map of approximately 380,000 yeast nucleosomes that we sequenced in their entirety. Utilizing the high resolution of our map, we refine our understanding of how nucleosome organizations are encoded by the DNA sequence and demonstrate that the genomic sequence is highly predictive of the in vivo nucleosome organization, even across new nucleosome-bound sequences that we isolated from fly and human. We find that Poly(dA:dT) tracts are an important component of these nucleosome positioning signals and that their nucleosome-disfavoring action results in large nucleosome depletion over them and over their flanking regions and enhances the accessibility of transcription factors to their cognate sites. Our results suggest that the yeast genome may utilize these nucleosome positioning signals to regulate gene expression with different transcriptional noise and activation kinetics and DNA replication with different origin efficiency. These distinct functions may be achieved by encoding both relatively closed (nucleosome-covered) chromatin organizations over some factor binding sites, where factors must compete with nucleosomes for DNA access, and relatively open (nucleosome-depleted) organizations over other factor sites, where factors bind without competition.
Conflict of interest statement
The authors have declared that no competing interests exist.
Figures
Figure 1. Nucleosome organization at two genomic regions.
Shown are the raw data measured in this study at two 1000bp-long genomic regions. Every cyan oval represents the genomic location of one nucleosome that we sequenced in its entirety. Also shown is the average nucleosome occupancy per basepair predicted by the sequence-based nucleosome model that we developed here (red), the raw hybridization signal of two microarray-based nucleosome maps , (green and purple traces), and the locations of nucleosomes that were computationally inferred from these hybridization signals , (green and purple ovals). Note that although the nucleosome calls from the microarray maps are close to nucleosome locations from our map, the microarray map does not reveal the underlying variability in the detailed nucleosome read locations that we observe in our data. Annotated genes , transcription factor binding sites , TATA sequences , and Poly(dA:dT) elements in the region are also shown (top).
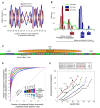
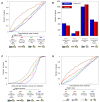
Figure 2. Nucleosome positioning signals in genomic sequence.
(A) Fraction (normalized, see Methods) of AA/AT/TA/TT and separately, CC/CG/GC/GG dinucleotides at each position of our center-aligned nucleosome-bound sequences with length 146–148, showing ∼10 bp periodicity of these dinucleotide sets. (B) Many 5-mers are enriched in linker or nucleosome regions. Shown is the distribution of (log base 2) ratios between the frequency of 5-mers in linker regions and in nucleosomal DNA regions for all 5-mers (green line), and for the 32 5-mers composed exclusively of either G/C (red bars) or A/T (blue bars) nucleotides. Linkers are taken as contiguous non-repetitive regions of lengths 50–500 bp that are not covered by any nucleosome read in our data. (C) Illustration of the key features of our probabilistic nucleosome–DNA interaction model, including the periodic dinucleotides patterns preferred within the nucleosome, and the 5-mers preferred in linkers. (D) Our model classifies linkers from nucleosomal DNA with high accuracy. Shown is the fraction of all measured nucleosomes that our model correctly classifies as nucleosomes (_y_-axis; true positive rate) against the fraction of all measured linkers that our model incorrectly classifies as nucleosomes (_x_-axis; false positive rate), for each possible threshold on the minimum score above which our model classifies a region as nucleosomal. The score of each measured nucleosome or linker is the mean score that our model assigns in the region that is within 20 bp from the center of the nucleosome or linker, respectively. Scores of the model are assigned using a cross validation scheme, in which every measured nucleosome or linker on a given chromosome is assigned a score using a model that was trained from the data of all other chromosomes. Linkers are defined as contiguous non-repetitive regions of lengths 50–500 bp that are not covered by any nucleosome in our data. Results are shown for separating these 8,017 linkers from nucleosomes with various levels of occupancy (1, 2, 4, 8, and 16), where the occupancy of a nucleosome is defined by the number of nucleosome reads whose center is within 20 bp of its own center. The number of nucleosomes in each classification group are 84,410 (occupancy 1), 69,703 (occupancy 2), 38,787 (occupancy 4), 12,076 (occupancy 8), and 1,601 (occupancy 16). (E) Shown is the combined nucleosome fold depletion over all homopolymeric tracts of A or T (Poly(dA:dT) elements) of length k, for k = 5,6,7,…, and for Poly(dA:dT) elements with exactly 0, 2, 4, or 6 base substitutions (mismatches). Each graph is trimmed at a length K in which there are less than 10 elements, and the fold depletion at this final point is computed over all elements whose length is at least K. The combined fold depletion of a set of genomic elements (_y_-axis) is the ratio between their expected and observed nucleosome coverage, where the expected coverage is the average coverage of any basepair according to our data, and the observed coverage is the average coverage of a basepair from the set (see Methods). The number of underlying elements at various points in the graph is indicated (N). See Figure S4 for a graph of all possible mismatches and showing the number of elements at all points.
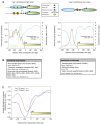
Figure 3. Periodicity of A/T and G/C dinucleotides around transcription start sites in yeast.
Shown is the frequency of dinucleotides composed exclusively of T/A dinucleotides (blue line), or of G/C dinucleotides (red line) around transcription start sites of yeast genes. Both sets of dinucleotides exhibit ∼10 bp periodicities, but with opposite phases, across a ∼50 bp region.
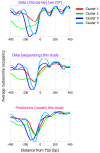
Figure 4. Our model predicts distinct nucleosome organizations around transcription start sites.
Shown is the average nucleosome organization around transcription start sites of four sets of genes that were reported in by clustering their measured nucleosome occupancy profiles. One of the four clusters reported in corresponds to promoters that lack a significant nucleosome depleted region (cluster 1; red line in plots). The other three clusters have a clear nucleosome depleted region in their promoters, and are also reported in as enriched for protein biosynthesis (cluster 2; green line), ribosome biogenesis (cluster 3; blue line), and protein modification (cluster 4; cyan line). The average nucleosome occupancy is shown from the original data of (top) that was used for the clustering, and for our data (middle), as well as for the predicted occupancy of the nucleosome positioning model that we developed here (bottom).
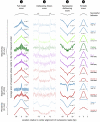
Figure 5. Testing the universality of nucleosome positioning signals across eukaryotes.
Our nucleosome model trained from yeast predicts nucleosome locations across several eukaryotes. For various nucleosome collections, including five new ones in fly and human that we isolated here, shown are scores assigned by our full model (“1”; score(S) from Equation 1 of the Methods section), by only the (position-independent) individual 5-mer component of the nucleosome-disfavoring component (“2”; Pl from Equation 1 above), by the entire nucleosome-disfavoring component of our model (“3”; PL from Equation 1 above), and by the (position-dependent) periodic component of our model (column “4”; PN from Equation 1 above). The sequences in each collection were mapped to their respective genome, and the score shown in each column at _x_-axis position i is the average score across all sequences in the collection, of the 147 bp (5 bp for column “2”) sequence whose center is i basepairs away from the center of the mapped sequence. For the full model (“1”) and nucleosome-disfavoring component (“3”), scores are shown in a window that extends up to 73 bp (half a nucleosome) around the center of the mapped nucleosome. Successful predictions assign their highest (“1”) or lowest (“3”) score at x-axis position zero. The _p_-value represents a student _t_-test that tests whether the distribution of scores in the 40 bp region centered on the mapped nucleosome is significantly higher (“1”) or lower (“3”) than that in the outer 40 bp (20 bp on each end of the mapped nucleosome). For the periodic component (“4”) scores are shown in a 10 bp window around the center of the mapped nucleosome, such that successful predictions assign the highest score at _x_-axis position zero; the _P_-value tests whether the distribution of scores in the 5 bp centered on the mapped nucleosome is significantly higher than that in the outer 6 bp (3 bp on each side, i.e., bp −5,−4,−3 and bp +3,+4,+5 from the center of the mapped nucleosome). Note that in several collections (e.g., worm), the 5-mer component itself (“2”) precisely demarcates the nucleosome positions, by assigning higher scores at the linker regions (more than 73 bp away from the center) compared to the nucleosomal regions (central 147 bp). For all four columns, the _y_-axis is scaled between the minimum and maximum score of the entire 293 bp region centered around the mapped nucleosome.
Figure 6. The sequence specificity of micrococcal nuclease is not the cause of nucleosome depletion over Poly(dA:dT) elements.
(A) Shown is a standard sequence logo representation of the sequence specificity of micrococcal nuclease, as determined by aligning the ∼1,000,000 cut sites that we obtained in our study. In this standard representation, every position represents the probability distribution over the four possible nucleotides at that position (relative to the yeast genome composition), by the information content contained in that distribution. As can be seen, the information content is low, indicating that although micrococcal nuclease does have detectable sequence specificity, this specificity is low and can thus be found in nearly every small stretch of DNA in the yeast genome. (B) Shown is the ranking of all 4096 possible 6-mers by their preference to be cut by micrococcal nuclease, defined as the ratio between the probability that they appear as a cut site and the probability that they appear in the yeast genome. The top ranking 6-mers are shown, along with the (low ranking) position of AAAAAA and TTTTTT. (C) Shown is the fraction of micrococcal nuclease cut sites in which there is a Poly(dA:dT) element k basepairs away from the cut site, when k ranges from −100 bp (i.e., 100 bp inside the mapped nucleosome) to 250 bp (outside). For this analysis we took perfect Poly(dA:dT) elements of length 6 or greater. Note that the most likely position for Poly(dA:dT) elements is not at the cut site but rather ∼50 bp from the cut site.
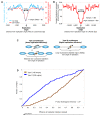
Figure 7. Nucleosome depleted regions are created in the vicinity of Poly(dA:dT) boundaries.
(A) A boundary constraint creates, on average, a larger nucleosome-depleted region that extends far into regions flanking the boundary. Shown is a simple example focusing only on the immediate neighborhood of the boundary. All (five) possible nucleosome configurations are illustrated, in which a nucleosome (cyan ovals) can be placed within five basepairs of the boundary (blue triangle). The number and set of nucleosome configurations occupying each of the five basepairs immediately adjacent to the boundary are shown in the graph and table, respectively. If all configurations are equally likely, then basepairs closer to the boundary will exhibit lower nucleosome occupancy. (B) Boundaries exhibit strong and long-range nucleosome depletion regardless of whether they are near transcription factor binding sites or whether they are in promoters or non-promoter intergenic regions. Shown is the average number of nucleosome reads in our data at locations k (for k = 1,2,…,150) basepairs away from boundaries (strength >5) that are: more than 30 bp from any factor site (green); within 30 bp of a factor site bound by its cognate factor (purple); in intergenic regions that are not promoters (orange). The strength of a boundary is defined by properties of the DNA sequence of the boundary, based on the length and perfection of the Poly(dA:dT) components of the boundary (see Methods). Plots are symmetric by construction. (C) Boundaries enhance the accessibility of transcription factors to cognate sites. Shown is the average number of nucleosome reads in our data at locations k (for k = 1,2,…,150) basepairs away from annotated factor binding sites bound by their cognate factor that are: more than 30 bp from any boundary (boundary strength >5) (blue); within 30 bp of any boundary (strength >5) (red). Plots are symmetric by construction.
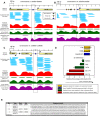
Figure 8. Poly(dA:dT) elements have a reduced affinity for nucleosome formation in vitro.
(A–C) Experimental maps of nucleosome occupancy at three genomic loci for which we measured the relative nucleosome affinity of Poly(dA:dT)-containing sequences (blue triangles). Every cyan oval represents the genomic location of one nucleosome that we sequenced in its entirety. Also shown is the average nucleosome occupancy per basepair predicted by the sequence-based nucleosome model that we developed here (red), the raw hybridization signals of two microarray-based nucleosome maps , (green and purple traces), and the locations of nucleosomes that were computationally inferred from these hybridization signals , (green and purple ovals). Annotated genes , transcription factor binding sites , and TATA sequences in the region are indicated. (D) Poly(dA:dT)-containing sequences have low nucleosome affinities. Shown are measurements of relative affinity for nucleosome formation of seven Poly(dA:dT)-containing sequences (blue bar; shown are mean and standard deviation for seven measured sequences: three boundary regions from yeast that each contain multiple Poly(dA:dT) elements, and four sequence variants that disrupt one of the Poly(dA:dT) elements in each sequence). For comparison, also shown are the relative affinities of sequences selected for their relative resistance to nucleosome formation (yellow bars), and of sequences selected for their high nucleosome affinity from the mouse genome (green bars) and from chemically synthesized random sequences , (red bars). All results are presented relative to the 5S reference sequence, defined as 0. (E) The sequences of the Poly(dA:dT)-containing elements of (a–c) that we measured, along with their chromosomal locations.
Figure 9. The level and length of nucleosome depletion around gene start and gene end sites correlate with boundary strength.
(A) Boundaries were classified into five groups by their nucleosome fold depletion (strength) using sequence rules (see Methods), and every gene was annotated by the classification of the strongest boundary that it has in the 200 bp region upstream of its transcription start site. Shown is the average number of nucleosomes per basepair around the transcription start site of genes from each of the four boundary classification groups. (B) Same as (A), but when annotating each gene by the classification of the strongest boundary that it has in the 200 bp region downstream of its translation end site (translation end site was chosen since transcription end sites are poorly annotated). Note that for a given boundary class, the corresponding genes in (A) are distinct from the corresponding genes in (B). (C,D) Same as (A) and (B), but plotting the average nucleosome occupancy predicted by the sequence-based nucleosome positioning model that we developed here. Predictions are generated in a cross validation scheme, such that the predicted nucleosome occupancy across each chromosome is computed by a model that was learned using only the nucleosome data of all the other chromosomes.
Figure 10. Boundaries enhance the accessibility of transcription factors to their cognate binding sites.
(A) Nucleosome depletion over factor sites increases with their proximity to, and with the strength of, boundaries. Shown is the combined nucleosome fold depletion over factor sites (_y_-axis) that are within a certain range of distances from boundaries that themselves have a particular nucleosome fold depletion (boundary strength; _x_-axis). Plots are shown for four different ranges of factor-boundary distances and for the four boundary strength groups of nucleosome fold depletions that we defined based on sequence rules (see Methods). (B) Factor binding sites near boundaries are depleted of nucleosomes. For each factor, shown is the combined nucleosome fold depletion over its annotated sites , that are within 30 bp from a boundary whose fold depletion is at least 5 (blue bars), and over the rest of its sites (green bars). The combined fold depletion of a set of genomic elements is the ratio between their expected and observed nucleosome coverage (see Methods).
Figure 11. Two different types of regulation by chromatin in yeast promoters.
(A) Promoters with TATA elements and whose binding sites are located in regions covered by nucleosomes exhibit large transcriptional noise. Genes were divided into four groups based on the presence or absence of TATA elements , and by whether their binding sites are covered by nucleosomes or are nucleosome-depleted as measured in our map (see Methods). For each group of genes, shown is the fraction of its genes (_y_-axis) whose noise level is within the k most noisy genes (_x_-axis; expressed as fraction), for all possible values of k. Measurements of transcriptional noise are available for 2197 genes and are presented in their ranked value. (B) Yeast promoters are enriched with architectures that are associated with high- and low-noise. For each of the four gene sets from (A), shown is the actual number of genes in each set (red bar) compared to the expected number of genes in each set (blue bar). The number of genes in the two extreme promoter types (type I: leftmost columns, genes with TATA elements and nucleosome-covered factor sites; type II: rightmost columns, genes without TATA elements and with nucleosome-depleted factor sites) is significantly more than would be expected just from the counts of the number of genes with/without TATA elements and with nucleosome-depleted/nucleosome-covered sites (P<10−16, hypergeometric test). (C) Promoters with TATA elements and whose binding sites are located in regions covered by nucleosomes as measured in our map exhibit large degrees of histone turnover. For each of the four gene sets from (A), shown is the fraction of its genes (_y_-axis) whose histone turnover level is within the _k_ promoters with the largest degree of histone turnover (_x_-axis; expressed as fraction), for all possible values of _k_. Measurements of histone turnover are presented in their ranked value. (D) Promoters with distinct transcriptional noise characteristics can be predicted from sequence alone. Same as (A), but when dividing genes using only sequence information, based on the presence of Poly(dA:dT)-boundaries and TATA elements. Genes were divided into four groups based on the presence of TATA elements , and by whether or not they have a boundary of strength >5 within the 200 bp region upstream of their transcription start site (where the boundary strength is defined based on DNA sequence alone).
Figure 12. Type I and Type II promoters have distinct architectures.
(A) Shown is a schematic illustration of promoter architectures for the two extreme types of promoters from Figure 11A. The schematic illustrates that in the high noise (Type I, left column) promoters, factor binding sites are measurably occupied by both their cognate factors and nucleosomes (in a cell population), suggesting that their high noise results from competition between nucleosomes and factors for DNA access. In contrast, the low noise (Type II, right column) promoters exhibit a characteristic nucleosome-depleted region upstream of the transcription start site in which bound factor sites are highly concentrated. Also shown is the average number of nucleosome reads in our data (cyan), and the distribution of factor sites (brown) and TATA elements (green, only for Type I promoters), around the transcription start site of the genes in each of the two extreme types of promoters from (A) (left column, Type I promoters; right column, Type II promoters). (B) Genes of the high- and low-noise promoter classes exhibit distinct functional enrichments. Shown is a selected list of functional categories that are significantly enriched (P<10−5) in the set of genes associated with each promoter type (see Figure S7 for the full list and details of all enrichments). (C) The distinct nucleosome organizations in high- and low-noise promoters can be predicted from DNA sequence. Shown is the average nucleosome occupancy predicted by the sequence-based model for nucleosome positioning that we developed here, for each of the two promoter types in (A).
Figure 13. Nucleosome positioning signals may explain DNA replication efficiency.
(A) Nucleosomes are depleted from origins of DNA replication in S. cerevisiae. Shown is the average number of nucleosome reads in our data (cyan) per basepair around 82 annotated origins of replication from yeast . Note that the typical length of the nucleosome depleted regions is greater around replication origins than it is around transcription start sites (e.g., compare to the length of the depleted region from Figure 9A and 9B). Also shown is the average nucleosome occupancy predicted by the nucleosome positioning model that we developed here (red), per basepair around the same 82 origins. (B) Nucleosome depletion is predicted around replication origins from S. pombe. Shown is the average nucleosome occupancy predicted by our nucleosome positioning model (red), per basepair in the vicinity of 386 annotated origins of replication from S. pombe. The exceptionally large length of the nucleosome depleted regions around these replication origins may reflect the lower resolution with which S. pombe origins are mapped (∼3 Kb), compared to their S. cerevisiae analogs. (C) Shown is a schematic illustration of replication origins with low and high replication efficiency. The schematic illustrates that in the low efficiency origins (“type I”, left column), binding sites for the replication machinery are measurably occupied by both their replication factors and nucleosomes (in a cell population), suggesting that their low efficiency results from competition between nucleosomes and factors for DNA access. In contrast, the high efficiency origins (“type II”, right column) exhibit a characteristic nucleosome-depleted region that allows the replication machinery to access the origins and replicate the DNA with high efficiency. (D) Replication origins from S. pombe that have large nucleosome depleted regions are utilized with greater efficiency. We computed the average (predicted) nucleosome occupancy in 500 bp windows within the 3 kb region surrounding each of the 386 annotated origins from (B). With each replication origin, we associated the lowest nucleosome occupancy in any of its 500 bp windows. The 3 kb region was selected since the data on replication efficiency have a ∼3 kb resolution ; 500 bp windows were selected since these are the typical lengths of the nucleosome depleted regions over origins in S. cerevisiae, where origins are mapped with greater accuracy. Using these computed lowest nucleosome occupancies for origins, we grouped together the 100 origins that have the highest of these values (type I), and the 100 origins that have the lowest of these values (type II). For each of these two groups, shown is the fraction of its origins (_y_-axis) whose efficiency of replication initiation as measured in is within the k most efficient origins (_x_-axis; expressed as fraction), for all possible values of k. Measurements of efficiency of replication initiation are presented in their ranked value.
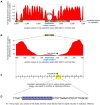
Figure 14. Deletion of a Poly(dA:dT) element from a replication origin results in a reduction in replication efficiency.
(A) Shown is the average (predicted) nucleosome occupancy of the nucleosome positioning model that we developed here (red) at the 6 kb region surrounding the one replication origin from S. pombe (“ARS 3002”) that was studied in the systematic sequence deletion study of . Our model predicts a nucleosome depleted region around the replication origin (“ARS 3002”). Annotated replication origins in the region were taken from (B) Same as (A), but only around the 815 bp region of the studied origin (“ARS 3002”). (C) Schematic representation of the 15 regions of length ∼50 bp that were each deleted in the study of . The replication efficiency of each of these 15 regions was tested in , and it was found that of all 15 regions, deletion of region 10 (which contains a Poly(dA:dT) element) resulted in the largest reduction in replication efficiency. (D) The DNA sequence of region 10 from . The Poly(dA:dT) element is indicated.
Similar articles
- A genomic code for nucleosome positioning.
Segal E, Fondufe-Mittendorf Y, Chen L, Thåström A, Field Y, Moore IK, Wang JP, Widom J. Segal E, et al. Nature. 2006 Aug 17;442(7104):772-8. doi: 10.1038/nature04979. Epub 2006 Jul 19. Nature. 2006. PMID: 16862119 Free PMC article. - Nucleosome positioning in yeasts: methods, maps, and mechanisms.
Lieleg C, Krietenstein N, Walker M, Korber P. Lieleg C, et al. Chromosoma. 2015 Jun;124(2):131-51. doi: 10.1007/s00412-014-0501-x. Epub 2014 Dec 23. Chromosoma. 2015. PMID: 25529773 Review. - Z curve theory-based analysis of the dynamic nature of nucleosome positioning in Saccharomyces cerevisiae.
Wu X, Liu H, Liu H, Su J, Lv J, Cui Y, Wang F, Zhang Y. Wu X, et al. Gene. 2013 Nov 1;530(1):8-18. doi: 10.1016/j.gene.2013.08.018. Epub 2013 Aug 16. Gene. 2013. PMID: 23958656 - Translational and rotational settings of H2A.Z nucleosomes across the Saccharomyces cerevisiae genome.
Albert I, Mavrich TN, Tomsho LP, Qi J, Zanton SJ, Schuster SC, Pugh BF. Albert I, et al. Nature. 2007 Mar 29;446(7135):572-6. doi: 10.1038/nature05632. Nature. 2007. PMID: 17392789 - Genome-Wide Analysis of Nucleosome Positions, Occupancy, and Accessibility in Yeast: Nucleosome Mapping, High-Resolution Histone ChIP, and NCAM.
Rodriguez J, McKnight JN, Tsukiyama T. Rodriguez J, et al. Curr Protoc Mol Biol. 2014 Oct 1;108:21.28.1-21.28.16. doi: 10.1002/0471142727.mb2128s108. Curr Protoc Mol Biol. 2014. PMID: 25271716 Free PMC article. Review.
Cited by
- How genotype-by-environment interactions on fitness emerge.
Aubé S, Landry CR. Aubé S, et al. Nat Ecol Evol. 2024 Nov 13. doi: 10.1038/s41559-024-02577-4. Online ahead of print. Nat Ecol Evol. 2024. PMID: 39537897 No abstract available. - Review and Evaluate the Bioinformatics Analysis Strategies of ATAC-seq and CUT&Tag Data.
Cheng S, Miao B, Li T, Zhao G, Zhang B. Cheng S, et al. Genomics Proteomics Bioinformatics. 2024 Sep 13;22(3):qzae054. doi: 10.1093/gpbjnl/qzae054. Genomics Proteomics Bioinformatics. 2024. PMID: 39255248 Free PMC article. Review. - Interpretable deep residual network uncovers nucleosome positioning and associated features.
Masoudi-Sobhanzadeh Y, Li S, Peng Y, Panchenko AR. Masoudi-Sobhanzadeh Y, et al. Nucleic Acids Res. 2024 Aug 27;52(15):8734-8745. doi: 10.1093/nar/gkae623. Nucleic Acids Res. 2024. PMID: 39036965 Free PMC article. - Histone deacetylase Hos2 regulates protein expression noise by potentially modulating the protein translation machinery.
Lin WH, Opoc FJG, Liao CW, Roy KR, Steinmetz LM, Leu JY. Lin WH, et al. Nucleic Acids Res. 2024 Jul 22;52(13):7556-7571. doi: 10.1093/nar/gkae432. Nucleic Acids Res. 2024. PMID: 38783136 Free PMC article. - Poly(dA:dT) Tracts Differentially Modulate Nucleosome Remodeling Activity of RSC and ISW1a Complexes, Exerting Tract Orientation-Dependent and -Independent Effects.
Amigo R, Raiqueo F, Tarifeño E, Farkas C, Gutiérrez JL. Amigo R, et al. Int J Mol Sci. 2023 Oct 17;24(20):15245. doi: 10.3390/ijms242015245. Int J Mol Sci. 2023. PMID: 37894925 Free PMC article.
References
- van Holde KE. Chromatin. New York: Springer; 1989.
- Ioshikhes IP, Albert I, Zanton SJ, Pugh BF. Nucleosome positions predicted through comparative genomics. Nat Genet. 2006;38:1210–1215. - PubMed
- Lee W, Tillo D, Bray N, Morse RH, Davis RW, et al. A high-resolution atlas of nucleosome occupancy in yeast. Nat Genet. 2007;39:1235–1244. - PubMed
Publication types
MeSH terms
Substances
Grants and funding
- R01 CA119176/CA/NCI NIH HHS/United States
- R01 CA119176-03/CA/NCI NIH HHS/United States
- R01 GM054692/GM/NIGMS NIH HHS/United States
- R01 GM058617/GM/NIGMS NIH HHS/United States
LinkOut - more resources
Full Text Sources
Other Literature Sources
Molecular Biology Databases

