Testing different types of genotype-environment correlation: an extended children-of-twins model - PubMed (original) (raw)
Testing different types of genotype-environment correlation: an extended children-of-twins model
Jurgita Narusyte et al. Dev Psychol. 2008 Nov.
Abstract
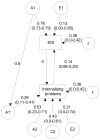
This study presents an extended children-of-twins model, which allowed the authors to test the direction of the association between parenting and child adjustment. Three mechanisms were examined: direct phenotypic influence of parenting on child behavior (controlling for both parental and child genotype), passive genotype-environment correlation, and evocative genotype-environment correlation. This model was tested with Monte Carlo simulations. The authors generated data sets consisting of 1,000 twin parent pairs together with their children and 1,000 twin children pairs together with their parents. These simulated data sets were then used to estimate the model, and the procedure was repeated 1,000 times. The simulation results showed that this model recovered the true values of parameters with high precision. The model was also applied to an observed data set to analyze, as a first example, the association between maternal emotional overinvolvement and child internalizing problems. The results showed that this association was best explained by evocative genotype-environment correlation.
Figures
Figure 1
Extended children-of-twins model. The model is described in two parts: for twin parents and for twin children. Phenotypes Parenting and Child Adjustment are denoted in rectangles. Genetic (A) and environmental (C, E) influences are depicted in circles. Parenting phenotype is influenced by genetic (A1), shared (C1), and non-shared environment (E1), while Child Adjustment is influenced by genetic (A1′ and A2), shared (C2), and non-shared environmental effects (E2). Measurement error (ε1 and ε2) contributes directly to the variance of both phenotypes. In twin parents part, the genetic effects correlate by 1.0 or 0.5, depending on the twin zygosity. Shared environment (C1) correlated perfectly for both MZ and DZ twins. Genetic effects for children, or cousins, correlate by 0.25 or 0.125, depending on the zygosity of the parents. Shared environmental effects are uncorrelated since the cousins do not share the family. In twin children part, genetic and shared environmental effects correlated perfectly for Parenting phenotype, because there was always the same parent rating both twins. For children, genetic effects correlated by 1.0 or 0.5 for MZ and DZ twins, respectively, and shared environmental effects correlated perfectly for both zygosity groups. Paths m and n denote reciprocity in the relationship between the phenotypes. Path m reflects direct environmental effect of Parenting on Child Adjustment, while path n denotes evocative processes in the relationship. Significant paths m, _a1_′ and a1 will indicate passive rGE, while evocative rGE will be suggested by significant n, _a1_′ and/or a2.
Figure 2
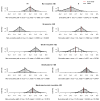
Figure 2a. Results of simulations: the phenotypes were influenced equally by genetics and environment. The dashed line indicates the true parameter value and the solid line denotes the mean of all parameter estimates. Every row of pictures represents the simulation with different values of m and n paths, reflecting different scenarios of rGE presence. Figure 2b. Results of simulations: genetic predominant variance structure of the phenotypes. Figure 2c. Environment predominant variance structure of the phenotypes.
Figure 3
Estimated children-of-twins model for maternal emotional overinvolvement and child internalizing problems. Note. * p < 0.05.
Similar articles
- Parental criticism and externalizing behavior problems in adolescents: the role of environment and genotype-environment correlation.
Narusyte J, Neiderhiser JM, Andershed AK, D'Onofrio BM, Reiss D, Spotts E, Ganiban J, Lichtenstein P. Narusyte J, et al. J Abnorm Psychol. 2011 May;120(2):365-76. doi: 10.1037/a0021815. J Abnorm Psychol. 2011. PMID: 21280930 Free PMC article. - Evocative gene-environment correlation in the mother-child relationship: a twin study of interpersonal processes.
Klahr AM, Thomas KM, Hopwood CJ, Klump KL, Burt SA. Klahr AM, et al. Dev Psychopathol. 2013 Feb;25(1):105-18. doi: 10.1017/S0954579412000934. Dev Psychopathol. 2013. PMID: 23398756 Free PMC article. - Boys' serotonin transporter genotype affects maternal behavior through self-control: a case of evocative gene-environment correlation.
Pener-Tessler R, Avinun R, Uzefovsky F, Edelman S, Ebstein RP, Knafo A. Pener-Tessler R, et al. Dev Psychopathol. 2013 Feb;25(1):151-62. doi: 10.1017/S095457941200096X. Dev Psychopathol. 2013. PMID: 23398759 - Accounting for genetic and environmental confounds in associations between parent and child characteristics: a systematic review of children-of-twins studies.
McAdams TA, Neiderhiser JM, Rijsdijk FV, Narusyte J, Lichtenstein P, Eley TC. McAdams TA, et al. Psychol Bull. 2014 Jul;140(4):1138-73. doi: 10.1037/a0036416. Epub 2014 Apr 21. Psychol Bull. 2014. PMID: 24749497 Review.
Cited by
- The Intergenerational Transmission of Anxiety: A Children-of-Twins Study.
Eley TC, McAdams TA, Rijsdijk FV, Lichtenstein P, Narusyte J, Reiss D, Spotts EL, Ganiban JM, Neiderhiser JM. Eley TC, et al. Am J Psychiatry. 2015 Jul;172(7):630-7. doi: 10.1176/appi.ajp.2015.14070818. Epub 2015 Apr 23. Am J Psychiatry. 2015. PMID: 25906669 Free PMC article. - The intergenerational multiple deficit model and the case of dyslexia.
van Bergen E, van der Leij A, de Jong PF. van Bergen E, et al. Front Hum Neurosci. 2014 Jun 2;8:346. doi: 10.3389/fnhum.2014.00346. eCollection 2014. Front Hum Neurosci. 2014. PMID: 24920944 Free PMC article. - Incorporating Polygenic Risk Scores in the ACE Twin Model to Estimate A-C Covariance.
Dolan CV, Huijskens RCA, Minică CC, Neale MC, Boomsma DI. Dolan CV, et al. Behav Genet. 2021 May;51(3):237-249. doi: 10.1007/s10519-020-10035-7. Epub 2021 Feb 1. Behav Genet. 2021. PMID: 33523349 Free PMC article. - Angry responses to infant challenges: parent, marital, and child genetic factors associated with harsh parenting.
Hajal N, Neiderhiser J, Moore G, Leve L, Shaw D, Harold G, Scaramella L, Ganiban J, Reiss D. Hajal N, et al. Child Dev. 2015 Jan-Feb;86(1):80-93. doi: 10.1111/cdev.12345. Epub 2015 Feb 2. Child Dev. 2015. PMID: 25641632 Free PMC article. - Parental criticism is an environmental influence on adolescent somatic symptoms.
Horwitz BN, Marceau K, Narusyte J, Ganiban J, Spotts EL, Reiss D, Lichtenstein P, Neiderhiser JM. Horwitz BN, et al. J Fam Psychol. 2015 Apr;29(2):283-9. doi: 10.1037/fam0000065. J Fam Psychol. 2015. PMID: 25844495 Free PMC article.
References
- Achenbach TM. Manual for the Child Behavior Checklist/4–18 and 1991 Profile. Burlington, VT: University of Vermont Department of Psychiatry; 1991.
- Asarnow JR, Tompson M, Woo S, Cantwell DP. Is expressed emotion a specific risk factor for depression or a nonspecific correlate of psychopathology? Journal of Abnormal Child Psychology. 2001;29(6):573–583. - PubMed
- Bartels M, Boomsma DI, Hudziak JJ, Rietveld MJH, van Beijsterveldt TCEM, van den Oord EJCG. Disentangling Genetic, Environmental, and Rater Effects on Internalizing and Externalizing Problem Behavior in 10-year-old Twins. Twin Research. 2004;7:162–175. - PubMed
- Brennan PA, Le Brocque R, Hammen C. Maternal depression, parent-child relationships, and resilient outcomes in adolescence. Journal of the American Academy of Child and Adolescent Psychiatry. 2003;42(12):1469–1477. - PubMed


