Interneuron diversity in layers 2-3 of monkey prefrontal cortex - PubMed (original) (raw)
Interneuron diversity in layers 2-3 of monkey prefrontal cortex
Aleksey V Zaitsev et al. Cereb Cortex. 2009 Jul.
Abstract
The heterogeneity of gamma-aminobutyric acid interneurons in the rodent neocortex is well-established, but their classification into distinct subtypes remains a matter of debate. The classification of interneurons in the primate neocortex is further complicated by a less extensive database of the features of these neurons and by reported interspecies differences. Consequently, in this study we characterized 8 different morphological types of interneurons from monkey prefrontal cortex, 4 of which have not been previously classified. These interneuron types differed in their expression of molecular markers and clustered into 3 different electrophysiological classes. The first class consisted of fast-spiking parvalbumin-positive chandelier and linear arbor cells. The second class comprised 5 different morphological types of continuous-adapting calretinin- or calbindin-positive interneurons that had the lowest level of firing threshold. However, 2 of these morphological types had short spike duration, which is not typical for rodent adapting cells. Neurogliaform cells (NGFCs), which coexpressed calbindin and neuropeptide Y, formed the third class, characterized by strong initial adaptation. They did not exhibit the delayed spikes seen in rodent NGFCs. These results indicate that primate interneurons have some specific properties; consequently, direct translation of classification schemes developed from studies in rodents to primates might be inappropriate.
Figures
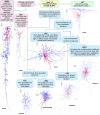
Figure 1.
Flow chart for morphological identification of layer 2–3 DLPFC monkey interneurons. All interneurons were 3-dimensional computer reconstructed using the Neurolucida tracing system. Interneuron somata and dendrites are drawn in red and the axons in blue. Scale bar = 100 μm. Layers are represented with Arabic figures.
Figure 2.
Morphological varieties of interneurons projecting to deep layers. (A) Confocal reconstruction of DBC. Confocal (B1) and Neurolucida (B2) reconstructions of the same VOBC. At the Neurolucida drawing soma and dendrites of VOBC are designated in red and the axons in blue. Potential postsynaptic cells for VOBC are shown in orange. Scale bars for reconstructed cells = 50 μm. (C) Axon terminals of VOBC formed appositions on unstained somata of potential postsynaptic cells, which were observed with differential interference contrast. Scale bar = 20 μm.
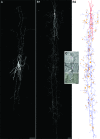
Figure 3.
Confocal reconstructions of cells with specialized axonal structures. (A) LPBC. Note that terminal parts of axon of LPBC formed appositions on unstained somata of potential postsynaptic cells, which were observed with differential interference contrast (inserts). (B) ChC. Axon terminals formed short vertical arrangements of boutons—axon cartridges. Scale bars for confocal images = 20 μm; scale bar for inserts = 10 μm.
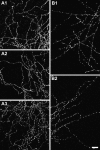
Figure 4.
Details of “curvy” (A1-A3) and “straight” (B1-B2) patterns of axonal arborization. A1 and A2: Confocal reconstruction of parts of axonal arbors from 2 CACs. A3: Example of curvy pattern of arborization from NGFC. B1 and B2: Straight pattern of arborization of 2 LACs. Scale bar = 10 μm.
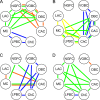
Figure 5.
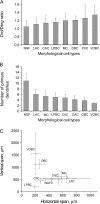
Results of a post hoc analysis (Fisher's LSD tests) of quantitative morphological properties. Cell types that are not statistically different are connected with the same color lines. Blue lines connecting cell types with the smallest values, green and yellow with medium, and red ones with the largest values. (A) Soma size. (B) Number of primary dendrites. Note that NGFCs are significantly different from all other morphological types by number of primary dendrites. (C) Horizontal axonal spread. (D) Vertical axonal spread.
Figure 6.
Quantitative morphological parameters of different types of interneurons. (A) The ratio between radial and tangential extends of the somata. (B) Number of primary dendrites. (C) Vertical and horizontal axonal spans of different types of interneurons (n = 85 interneurons). Circles represent mean values and bars are standard deviations. Note that LPBCs, ChCs, DBCs, and VOBCs usually do not exceed one cortical column, whereas NGFCs, MCs, CACs, and LACs innervate adjacent columns as well.
Figure 7.
Molecular characterization of monkey DLPFC interneurons. Double and triple immunostaining for Biocytin (blue) and CaBPs and neuropeptides (red and green alternatively) in VOBC, MC, LAC, and NGFC. Scale bars = 20 μm. Utilization of confocal microscopy with high-resolution objective (×40/1.3 N.A.) precluded bleaching of labeled cell from other depth of fields.
Figure 8.
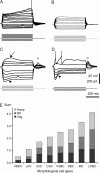
Representative examples of subthreshold responses in monkey interneurons. (A) Example of ramp depolarization observed in ChC. (B) Subthreshold responses of NGFC. (C and D) Subthreshold responses in CAC (C) demonstrated smaller amplitude of hump (arrow), sag (arrowhead), and RD (asterisk) than in LPBC (D). APs were truncated at (A and D). (E) Bar graph demonstrating averaged components of Sum values for different morphological types of interneurons; ANOVA revealed significant differences between morphological types by all 4 parameters (P < 0.01).
Figure 9.
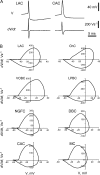
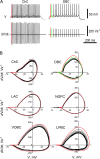
Spike duration and its shape were different in distinct morphological types of interneurons. (A) Illustration of APs and their derivations from LAC and CAC. V is membrane voltage, and d_V_/d_t_ is the time derivative of membrane voltage. Note the difference in spike duration between cells; faster and deeper repolarization rate in the narrow spike of LAC than in CAC. (B) On phase plots, APs were represented by loops, which had different shapes. In cells with the briefest spikes (LAC and ChC) they had a shape of rocking chair. Shape of the spikes of VOBCs and LPBCs in these plots resembled in appearance a snail. The third type of loops resembled in appearance a vertically oriented egg and was typical for interneurons with longer spike duration (CACs, MCs, DBCs, and NGFCs).
Figure 10.
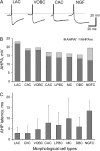
AHP had different shape and latency in distinct morphological types of interneurons. (A) Representative examples of AHP shapes from different types of interneurons (see explanation in the text). (B) Bar graph representing the averaged amplitude of fast and medium components of AHP in different types of interneurons. Note that impact of medium component to the total AHPA was relatively small in LACs, ChCs, and VOBCs (5–8%), more profound in CACs, MCs, DBCs, and LPBCs (13–18%), and very large in NGFCs (40%). (C) Bar graph demonstrating AHP latency; cells with larger amplitude of medium component AHP exhibited longer AHP. Latency of AHP in NGF cells was almost 5 times longer than in LACs or ChC.
Figure 11.
Interneurons of different morphological types exhibited specific firing patterns. Firing patterns from ChC, VOBC, CAC, and NGFC represented the firing patterns that were typically observed in monkey interneurons. (A) Overlapped first (gray) and last (black) APs from the train. Note that amplitude of spikes and their duration did not change in ChC and NGFC during train, whereas in VOBC and CAC they changed. (B) Sweeps with the responses to the first suprathreshold current step and to the 2× threshold current step. Compare the shape of AHP after first spike and after other spikes in the train in different morphological types; first AHP was enlarged in VOBC, whereas in NGFC it was reduced. (C) Plots of instantaneous frequency against ISI number, calculated from subsequent sweeps with the responses to increasing suprathreshold current steps (step = 10 pA). Note the absence of significant spike frequency adaptation on ChC at any stimulation current steps, short initial facilitation and then moderate adaptation in VOBC, and different level of initial adaptation in CAC and NGFC.
Figure 12.
Shape of AHP of first spike in the trains was dependent on stimulation current in NGFC. Medium component of AHP was significantly reduced in amplitude with increase of depolarizing current. Note the appearance of an additional depolarizing component (arrow) with the increasing stimulation currents that leaded to significant reduction of total AHPA and to the reduction of the first ISI. APs are truncated. Light gray line shows the level of AHP, gray line the fast component of AHP, and dark gray line the most negative membrane potential after first spike.
Figure 13.
Spike shape was preserved during trains in LAC and ChC, whereas in other morphological types it was changed. (A) Illustration of APs trains and their derivations from ChC and DBC. Note the difference in spike shapes of DBC during train was more obvious at the voltage derivation graph. V is membrane voltage, and d_V_/d_t_ is the time derivative of membrane voltage. (B) Phase diagram of subsequent APs in the trains. First AP is shown in red. Note that shape of the first spike was undistinguishable from subsequent spikes in the train in ChC and LAC, slightly shifted to the left in NGFC. In other cell types, subsequent spikes had smaller area.
Figure 14.
The graph of the averaged factor scores of different morphological types. The first factor described properties, associated with frequency of firing, the second cell excitability, and the third adaptation. Morphological types formed 3 clusters, which shared the most similar combinations of physiological properties or formed 3 different physiological classes. First class consisted of ChCs and LACs, and according to their factor scores (high-frequency nonadapting firing pattern, low level of excitability), they could be recognized as FS cells. Second physiological class consisted of only NGFCs, which were i-Ad cells with high threshold of firing and the lowest firing frequency. Third class of c-Ad cells was formed by CACs, MCs, DBCs, VOBCs, and LPBCs, which all had positive scores for factor of excitability, distinguished them from all other morphological types. Cells of that class exhibited the moderate level of firing frequency and its adaptation.
Similar articles
- Cluster analysis-based physiological classification and morphological properties of inhibitory neurons in layers 2-3 of monkey dorsolateral prefrontal cortex.
Krimer LS, Zaitsev AV, Czanner G, Kröner S, González-Burgos G, Povysheva NV, Iyengar S, Barrionuevo G, Lewis DA. Krimer LS, et al. J Neurophysiol. 2005 Nov;94(5):3009-22. doi: 10.1152/jn.00156.2005. Epub 2005 Jun 29. J Neurophysiol. 2005. PMID: 15987765 - Localization of calcium-binding proteins in physiologically and morphologically characterized interneurons of monkey dorsolateral prefrontal cortex.
Zaitsev AV, Gonzalez-Burgos G, Povysheva NV, Kröner S, Lewis DA, Krimer LS. Zaitsev AV, et al. Cereb Cortex. 2005 Aug;15(8):1178-86. doi: 10.1093/cercor/bhh218. Epub 2004 Dec 8. Cereb Cortex. 2005. PMID: 15590911 - Functional properties of fast spiking interneurons and their synaptic connections with pyramidal cells in primate dorsolateral prefrontal cortex.
González-Burgos G, Krimer LS, Povysheva NV, Barrionuevo G, Lewis DA. González-Burgos G, et al. J Neurophysiol. 2005 Feb;93(2):942-53. doi: 10.1152/jn.00787.2004. Epub 2004 Sep 22. J Neurophysiol. 2005. PMID: 15385591 - Three groups of interneurons account for nearly 100% of neocortical GABAergic neurons.
Rudy B, Fishell G, Lee S, Hjerling-Leffler J. Rudy B, et al. Dev Neurobiol. 2011 Jan 1;71(1):45-61. doi: 10.1002/dneu.20853. Dev Neurobiol. 2011. PMID: 21154909 Free PMC article. Review. - Plasticity of Persistent Activity and Its Constraints.
Li S, Zhou X, Constantinidis C, Qi XL. Li S, et al. Front Neural Circuits. 2020 May 7;14:15. doi: 10.3389/fncir.2020.00015. eCollection 2020. Front Neural Circuits. 2020. PMID: 32528254 Free PMC article. Review.
Cited by
- Differences in expression of calcium binding proteins in the perirhinal and retrosplenial cortex of the rat.
Salaj M, Barinka F, Kubová H, Druga R. Salaj M, et al. Physiol Res. 2021 Apr 30;70(2):273-285. doi: 10.33549/physiolres.934548. Physiol Res. 2021. PMID: 33992048 Free PMC article. - Beyond the frontiers of neuronal types.
Battaglia D, Karagiannis A, Gallopin T, Gutch HW, Cauli B. Battaglia D, et al. Front Neural Circuits. 2013 Feb 7;7:13. doi: 10.3389/fncir.2013.00013. eCollection 2013. Front Neural Circuits. 2013. PMID: 23403725 Free PMC article. - Serial Prefrontal Pathways Are Positioned to Balance Cognition and Emotion in Primates.
Joyce MKP, García-Cabezas MÁ, John YJ, Barbas H. Joyce MKP, et al. J Neurosci. 2020 Oct 21;40(43):8306-8328. doi: 10.1523/JNEUROSCI.0860-20.2020. Epub 2020 Sep 28. J Neurosci. 2020. PMID: 32989097 Free PMC article. - Functional maturation of hPSC-derived forebrain interneurons requires an extended timeline and mimics human neural development.
Nicholas CR, Chen J, Tang Y, Southwell DG, Chalmers N, Vogt D, Arnold CM, Chen YJ, Stanley EG, Elefanty AG, Sasai Y, Alvarez-Buylla A, Rubenstein JL, Kriegstein AR. Nicholas CR, et al. Cell Stem Cell. 2013 May 2;12(5):573-86. doi: 10.1016/j.stem.2013.04.005. Cell Stem Cell. 2013. PMID: 23642366 Free PMC article. - Mechanisms of inhibition within the telencephalon: "where the wild things are".
Fishell G, Rudy B. Fishell G, et al. Annu Rev Neurosci. 2011;34:535-67. doi: 10.1146/annurev-neuro-061010-113717. Annu Rev Neurosci. 2011. PMID: 21469958 Free PMC article. Review.
References
- Aizenman CD, Linden DJ. Regulation of the rebound depolarization and spontaneous firing patterns of deep nuclear neurons in slices of rat cerebellum. J Neurophysiol. 1999;82:1697–1709. - PubMed
- Avoli M, Williamson A. Functional and pharmacological properties of human neocortical neurons maintained in vitro. Prog Neurobiol. 1996;48:519–554. - PubMed
- Bean BP. The action potential in mammalian central neurons. Nat Rev Neurosci. 2007;8:451–465. - PubMed
- Beierlein M, Gibson JR, Connors BW. A network of electrically coupled interneurons drives synchronized inhibition in neocortex. Nat Neurosci. 2000;3:904–910. - PubMed
