Lysosomal enzyme cathepsin D protects against alpha-synuclein aggregation and toxicity - PubMed (original) (raw)
doi: 10.1186/1756-6606-1-17.
Shusei Hamamichi, Kim A Caldwell, Guy A Caldwell, Talene A Yacoubian, Scott Wilson, Zuo-Lei Xie, Lisa D Speake, Rachael Parks, Donna Crabtree, Qiuli Liang, Stephen Crimmins, Lonnie Schneider, Yasuo Uchiyama, Takeshi Iwatsubo, Yi Zhou, Lisheng Peng, YouMing Lu, David G Standaert, Ken C Walls, John J Shacka, Kevin A Roth, Jianhua Zhang
Affiliations
- PMID: 19021916
- PMCID: PMC2600785
- DOI: 10.1186/1756-6606-1-17
Lysosomal enzyme cathepsin D protects against alpha-synuclein aggregation and toxicity
Liyan Qiao et al. Mol Brain. 2008.
Abstract
α-synuclein (α-syn) is a main component of Lewy bodies (LB) that occur in many neurodegenerative diseases, including Parkinson's disease (PD), dementia with LB (DLB) and multi-system atrophy. α-syn mutations or amplifications are responsible for a subset of autosomal dominant familial PD cases, and overexpression causes neurodegeneration and motor disturbances in animals. To investigate mechanisms for α-syn accumulation and toxicity, we studied a mouse model of lysosomal enzyme cathepsin D (CD) deficiency, and found extensive accumulation of endogenous α-syn in neurons without overabundance of α-syn mRNA. In addition to impaired macroautophagy, CD deficiency reduced proteasome activity, suggesting an essential role for lysosomal CD function in regulating multiple proteolytic pathways that are important for α-syn metabolism. Conversely, CD overexpression reduces α-syn aggregation and is neuroprotective against α-syn overexpression-induced cell death in vitro. In a C. elegans model, CD deficiency exacerbates α-syn accumulation while its overexpression is protective against α-syn-induced dopaminergic neurodegeneration. Mutated CD with diminished enzymatic activity or overexpression of cathepsins B (CB) or L (CL) is not protective in the worm model, indicating a unique requirement for enzymatically active CD. Our data identify a conserved CD function in α-syn degradation and identify CD as a novel target for LB disease therapeutics.
Figures
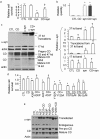
Figure 1
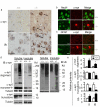
α-syn accumulates in neuronal cell bodies in p25 _Ctsd_-/- cortex. a. Immunohistochemical detection of α-syn and ubiquitin in p25 Ctsd+/+ (+/+) and _Ctsd_-/- (-/-) cortex. Scale bar = 20 micron. Arrows point to intense α-syn and ubiquitin immunoreactive cells. b. α-syn accumulation occurs in NeuN+ neuronal cell bodies. α-syn = Cy3 (red), NeuN = FITC (green). Wildtype (+/+) brains exhibit diffuse α-syn staining consistent with a synaptic distribution. _Ctsd_-/- brains showed neurons with cytoplasmic accumulation of α-syn immunoreactivity. Scale bar = 10 micron. c. α-syn does not exhibit pronounced accumulation in GFAP+ cells. α-syn = Cy3 (red). GFAP = FITC (green). Scale bar = 10 micron. d. Accumulation of high molecular weight α-syn and ubiquitinated proteins in both the TritonX-100 soluble and the insoluble fractions of the _Ctsd_-/- mice. Intensity of α-syn monomer, α-syn oligomers, and Ub-positive smears were quantified and compared between Ctsd+/+ and _Ctsd_-/- extracts. Truncated 12 kDa and 10 kDa α-syn fragments are reduced in _Ctsd_-/- extracts. e. Quantification of the western results. n = 3 mice each genotype. *p < 0.05 compared to Ctsd+/+ by Student t-test. S = TritonX-100 soluble. IS = TritonX-100 insoluble. f. A small fraction of accumulated α-syn in _Ctsd_-/- brains being mono-ubiquitinated. Western blot analysis of TritonX-100 soluble _Ctsd_-/- brain extract (Input), pulldown product by a polyclonal α-syn antibody C-20 (Santa Cruz) (middle lane), and pulldown product by a same-isotype control antibody (IgG). Immunoblot was probed with mAb1510 against ubiquitin. Shown are the 25 kDa bands of ubiquitin immunoreactivity that were pulled down by the C-20 anti-α-syn antibody. g. Western blot analysis of ubiquitin with p21 Ctsd+/+ and _Ctsd_-/- cortical extracts. The intensity of each lane was quantified and shown in the bar graph. *p < 0.05 Student t-test. h. Western blot analyses of Ctsd+/+ and _Ctsd_-/- cortical extracts, together with human DLB brain extracts using anti-phospho-α-syn antibody provided by Dr. Iwatsubo [33,36,38]. Arrows indicate positions of immunoreactive bands that are increased in _Ctsd_-/- mice and the position of α-syn monomer.
Figure 2
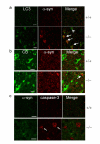
α-syn accumulation does not co-localize with LC3 or CB immunoreactivity and is independent of active caspase-3 immunoreactivity. a. Immunostaining with Atg8/LC3 and α-syn antibodies shows that LC3 staining is increased in _Ctsd_-/- mice compared to Ctsd+/+ mice, and intense α-syn immunoreactivity does not colocalize with LC3 immunoreactivity (arrows, p25). LC3 = FITC (green). α-syn = Cy3 (red). Arrowheads point to cells with high LC3 immunoreactivity but without intense α-syn immunostaining. b. α-syn accumulation does not overlap with CB immunoreactivity. CB = FITC (green). α-syn = Cy3 (red). Arrow points to α-syn intense immunoreactive staining adjacent to CB staining. c. Neurons with active caspase-3 immunoreactivity do not exhibit intense α-syn immunoreactivity in _Ctsd_-/- brains. α-syn = FITC (green). Active caspase-3 = Cy3 (red). Arrows point to active caspase-3 immunoreactivity. Scale bar = 10 micron. n = 3 mice each genotype.
Figure 3
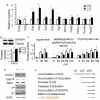
Deficits of proteasomes in CD deficient mice. a. α-syn (Snca) mRNA is down-regulated in CD deficient brains compared to wildtype control brains. Ctsb, Ctsl, Ctsf, Ctsh, Atg7, UCHL1, Park2, and Psmb7 mRNA levels are up-regulated. Atg12 and Psmb6 mRNA levels appear to be normal. b. Western blot analyses show an increase of steady state GAPDH, a CMA substrate. n = 3 p25 brain. *p < 0.05 by Student t-test, compared between Ctsd+/+ and _Ctsd_-/- brains. c. Extracts from _Ctsd_-/- cortex exhibit reduced proteasome activities compared to Ctsd+/+ as indicated by assays with trypsin-like fluorigenic substrate (VGR-AMC, reaching maximum at 60 min), chymotrypsin-like fluorigenic substrate (Z-GGL-AMC, reaching maximum at 120 min), and peptidylglutamyl peptide-like fluorigenic substrate (Suc-LLVY-AMC, reaching maximum at 120 min). The activities that are inhibitable by the proteasome inhibitor lactacystin were quantified. n = 3 mice each genotype. *p < 0.05 by Student t-test. d. Normal expression of proteins involved in UPS. Western blot analyses of UCHL1, Usp14, Rpt3, α4 and β1 indicate that these UPS factors are expressed normally in Ctsd+/+ and _Ctsd_-/- cortical extracts. Actin immunoblotting was used as a loading control. n = 3 mice each genotype. e. A diagram regarding onset of relative pathologies.
Figure 4
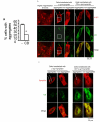
CD reduces α-syn aggregation. a. CD reduces α-syn aggregation in an aggregation assay. 50% of the cells transfected with α-syn-GFP, synphilin and empty vector exhibited visible α-syn aggregates. Co-transfection of CD together with α-syn-GFP and synphilin reduced the number of cells with visible α-syn aggregates to 20%. n = 3 independent transfection, each in quadruplicate. *p < 0.05 compared to absence of exogenous CD by Student t-test. b. Double immunostaining for CD and α-syn in the aggregation assay after transfection of H4 cells with α-syn+synphilin+vector and α-syn+synphilin+CD. Many more cells transfected with synphilin+α-syn+vector have α-syn aggregates than cells transfected with synphilin+α-syn+CD. α-syn = red; CD = green. Higher magnification images of the boxed areas are shown at the left-most panel. α-syn aggregates tended to be found in cellular areas with low levels of CD staining, in H4 cells with either α-syn+synphilin+vector or α-syn+synphilin+CD. Scale bar = 25 micron. Arrows point to α-syn aggregates. c. Double immunostaining for CD and the V5 tag of synphilin in the aggregation assay after transfection of H4 cells with α-syn+synphilin+vector and α-syn+synphilin+CD. Many more cells transfected with synphilin+α-syn+vector have α-syn aggregates than cells transfected with synphilin+α-syn+CD. Synphilin = red; CD = green. The levels of synphilin immunostaining were indistinguishable in cells transfected with synphilin+α-syn+vector versus cells transfected with synphilin+α-syn+CD. This is true in cells with or without aggregates. Scale bar = 25 micron. Arrows point to α-syn aggregates.
Figure 5
CD reduces α-syn toxicity. a. Enhanced CD expression protects against α-syn overexpression-induced cell death. GFP was visualized under the fluorescence microscope and demonstrated more survival cells after co-transfection of GFP-α-syn and CD compared to transfection with GFP-α-syn alone. Viable cells were counted by trypan blue exclusion method. b. mRNA of α-syn is unchanged by CD transfection. SHSY5Y cells were transfected with vector alone, CD, α-syn, or α-syn+CD. Paired Student t-tests were conducted on RQ values for each group to determine significance. c. Western blot analyses indicate that CD transfection results in truncation of α-syn-GFP (the appearance of a band below the full-length 37 kDa band), and a reduction of endogenous 17 kDa α-syn monomers. CD is synthesized as a prepropeptide (53 kDa); the signal peptide is cleaved upon CD insertion into the endoplasmic reticulum (47 kDa). The CD zymogen is then activated in the acidic lysosomal environment to produce the 32 and 14 kDa products [13,47]. d. Enhanced CD expression reduces A53T and A30P mutant α-syn-induced cell death, but does not reduce Y125A mutant α-syn-, 10 μM chloroquine-, or 2 μM staurosporine-induced cell death. For a-d, *p < 0.05 compared to control (CTL); †p < 0.05 compared to otherwise identical transfection except without CD. n = 3 transfection for each experimental conditions. Student t-test was used. e. Increased protein levels correlate with transfection of respective cDNAs. SHSY5Y cells were transfected with control vector, or respective cDNA in each lane. The respective antibodies used for the immunoblots are at the left side of the gel images. Mutated α-syn-GFP were produced. CD transfection did not produce significant truncation intermediate products on the mutated α-syn-GFP, suggesting that the protection against A53T and A30P may be via alteration of their intracellular targeting rather than direct cleavage. CD 53 kDa and 47 kDa precursors and the 32 kDa mature product are shown. Actin immunoblot was used as a loading control.
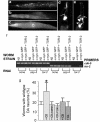
Figure 6
Increased CD expression reduces α-syn-toxicity in C. elegans. a. RNAi knockdown of a C. elegans Ctsd ortholog worsens aggregation of human α-syn in vivo. Isogenic worm strain expressing α-syn::GFP alone (a) or with TOR-2 (b), in body wall muscle cells of C. elegans. The presence of TOR-2, a protein with chaperone activity, attenuates the misfolded α-syn protein (b). When worms expressing α-syn::GFP + TOR-2 are exposed to CD RNAi, the misfolded α-syn::GFP returns (c). d-f. Overexpression of CD protects DA neurons from α-syn-induced degeneration. Worm DA neurons degenerate as animals age. At the 7 d stage, most worms are missing anterior DA neurons of the CEP (cephalic) and/or ADE (anterior deirid) classes. d. Note the presence of 3 of 4 CEP DA neurons (arrows) and the absence of the 2 ADE neurons. e. Overexpression of CD protects worms from neurodegeneration whereby worms display all 4 CEP (arrows) and both ADE (arrowheads) neurons. f. RNAi knock down of asp-4 does not reduce tor-2 expression level. Semi-quantitative RT-PCR was performed by using primers to amplify _cdk-_5 (loading control) and tor-2. For all strains analyzed, normal (non-RNAi) condition was used as a negative control, and tor-2 RNAi was used as a positive control.g. The percentage of worms exhibiting the wildtype neuronal complement of all 6 anterior DA neurons (30%) was significantly greater than animals without CD overexpression (15%). CD mutants (D295R and F229I), CB and CL, in transgenic worms overexpressing human cDNAs encoding these mutated CD or the representative lysosomal cysteine proteases, do not have the same effect as the wildtype CD in reducing α-syn toxicity. *p < 0.001 compared to α-syn alone, by Fisher Exact Test.
Similar articles
- C-terminal α-synuclein truncations are linked to cysteine cathepsin activity in Parkinson's disease.
McGlinchey RP, Lacy SM, Huffer KE, Tayebi N, Sidransky E, Lee JC. McGlinchey RP, et al. J Biol Chem. 2019 Jun 21;294(25):9973-9984. doi: 10.1074/jbc.RA119.008930. Epub 2019 May 15. J Biol Chem. 2019. PMID: 31092553 Free PMC article. - Roflupram protects against rotenone-induced neurotoxicity and facilitates α-synuclein degradation in Parkinson's disease models.
Dong WL, Zhong JH, Chen YQ, Xie JF, Qin YY, Xu JP, Cai NB, Li MF, Liu L, Wang HT. Dong WL, et al. Acta Pharmacol Sin. 2021 Dec;42(12):1991-2003. doi: 10.1038/s41401-021-00768-4. Epub 2021 Sep 16. Acta Pharmacol Sin. 2021. PMID: 34531546 Free PMC article. - Cathepsin L prevents the accumulation of alpha-synuclein fibrils in the cell.
Matsuki A, Watanabe Y, Hashimoto S, Hoshino A, Matoba S. Matsuki A, et al. Genes Cells. 2024 Apr;29(4):328-336. doi: 10.1111/gtc.13099. Epub 2024 Feb 17. Genes Cells. 2024. PMID: 38366711 - Alteration of Structure and Aggregation of α-Synuclein by Familial Parkinson's Disease Associated Mutations.
Sahay S, Ghosh D, Singh PK, Maji SK. Sahay S, et al. Curr Protein Pept Sci. 2017;18(7):656-676. doi: 10.2174/1389203717666160314151706. Curr Protein Pept Sci. 2017. PMID: 26972727 Review. - The contribution of alpha synuclein to neuronal survival and function - Implications for Parkinson's disease.
Benskey MJ, Perez RG, Manfredsson FP. Benskey MJ, et al. J Neurochem. 2016 May;137(3):331-59. doi: 10.1111/jnc.13570. Epub 2016 Mar 23. J Neurochem. 2016. PMID: 26852372 Free PMC article. Review.
Cited by
- Protein degradation pathways in Parkinson's disease: curse or blessing.
Ebrahimi-Fakhari D, Wahlster L, McLean PJ. Ebrahimi-Fakhari D, et al. Acta Neuropathol. 2012 Aug;124(2):153-72. doi: 10.1007/s00401-012-1004-6. Epub 2012 Jun 29. Acta Neuropathol. 2012. PMID: 22744791 Free PMC article. Review. - Recombinant pro-CTSD (cathepsin D) enhances SNCA/α-Synuclein degradation in α-Synucleinopathy models.
Prieto Huarcaya S, Drobny A, Marques ARA, Di Spiezio A, Dobert JP, Balta D, Werner C, Rizo T, Gallwitz L, Bub S, Stojkovska I, Belur NR, Fogh J, Mazzulli JR, Xiang W, Fulzele A, Dejung M, Sauer M, Winner B, Rose-John S, Arnold P, Saftig P, Zunke F. Prieto Huarcaya S, et al. Autophagy. 2022 May;18(5):1127-1151. doi: 10.1080/15548627.2022.2045534. Epub 2022 Apr 28. Autophagy. 2022. PMID: 35287553 Free PMC article. - Lack of Cathepsin D in the central nervous system results in microglia and astrocyte activation and the accumulation of proteinopathy-related proteins.
Suzuki C, Yamaguchi J, Sanada T, Oliva Trejo JA, Kakuta S, Shibata M, Tanida I, Uchiyama Y. Suzuki C, et al. Sci Rep. 2022 Jul 8;12(1):11662. doi: 10.1038/s41598-022-15805-3. Sci Rep. 2022. PMID: 35804072 Free PMC article. - Over-expression of an inactive mutant cathepsin D increases endogenous alpha-synuclein and cathepsin B activity in SH-SY5Y cells.
Crabtree D, Dodson M, Ouyang X, Boyer-Guittaut M, Liang Q, Ballestas ME, Fineberg N, Zhang J. Crabtree D, et al. J Neurochem. 2014 Mar;128(6):950-61. doi: 10.1111/jnc.12497. Epub 2013 Nov 13. J Neurochem. 2014. PMID: 24138030 Free PMC article.
References
Publication types
MeSH terms
Substances
Grants and funding
- R01 NS041962/NS/NINDS NIH HHS/United States
- P30 NS057098/NS/NINDS NIH HHS/United States
- R01NS5051383/NS/NINDS NIH HHS/United States
- R01 NS035107/NS/NINDS NIH HHS/United States
- NS35107/NS/NINDS NIH HHS/United States
- R01AG033282/AG/NIA NIH HHS/United States
- NS41962/NS/NINDS NIH HHS/United States
- R01 NS050355/NS/NINDS NIH HHS/United States
- R01 AG033282/AG/NIA NIH HHS/United States
- P30 NS047466/NS/NINDS NIH HHS/United States
- R01 NS051383/NS/NINDS NIH HHS/United States
LinkOut - more resources
Full Text Sources
Other Literature Sources
Miscellaneous
