Gene regulation in primates evolves under tissue-specific selection pressures - PubMed (original) (raw)
Gene regulation in primates evolves under tissue-specific selection pressures
Ran Blekhman et al. PLoS Genet. 2008 Nov.
Erratum in
- PLoS Genet. 2009 Mar;5(3). doi: 10.1371/annotation/06105fdb-f0fa-4fe2-88d0-db9f6036509f
Abstract
Regulatory changes have long been hypothesized to play an important role in primate evolution. To identify adaptive regulatory changes in humans, we performed a genome-wide survey for genes in which regulation has likely evolved under natural selection. To do so, we used a multi-species microarray to measure gene expression levels in livers, kidneys, and hearts from six humans, chimpanzees, and rhesus macaques. This comparative gene expression data allowed us to identify a large number of genes, as well as specific pathways, whose inter-species expression profiles are consistent with the action of stabilizing or directional selection on gene regulation. Among the latter set, we found an enrichment of genes involved in metabolic pathways, consistent with the hypothesis that shifts in diet underlie many regulatory adaptations in humans. In addition, we found evidence for tissue-specific selection pressures, as well as lower rates of protein evolution for genes in which regulation evolves under natural selection. These observations are consistent with the notion that adaptive circumscribed changes in gene regulation have fewer deleterious pleiotropic effects compared with changes at the protein sequence level.
Conflict of interest statement
The authors have declared that no competing interests exist.
Figures
Figure 1. Estimates of lineage-specific expression changes.
A. Increase (green bars) and decrease (red bars) of gene expression levels in the human (dH, top) and chimpanzee (dC, bottom) lineages are plotted. B. Box plots of the estimated expression changes (y-axis) along the human (red) and chimpanzee (purple) lineages in liver, kidney, and heart (x-axis).
Figure 2. Examples of expression patterns that are consistent with the action of natural selection.
Liver expression profiles from the three species are plotted for genes whose regulation has likely evolved under stabilizing (A) or directional (B) selection. In all panels, the mean (±s.e.m) log expression level (y-axis) of each species (x-axis) is plotted relative to the human value.
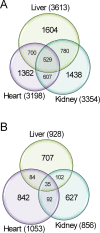
Figure 3. Comparison of data across tissues.
Venn diagrams showing the number of genes whose regulation likely evolved under stabilizing (A) and directional (B) selection in liver, kidney, and heart.
Figure 4. Directional selection on gene regulation in humans affects metabolic pathways.
The interaction network was generated using the Ingenuity Pathway Analysis (IPA) tool (version 6.0). All shaded nodes represent genes whose regulation evolves under directional selection. Transcription factors are shaded in orange. Specific metabolic functions that are associated with the individual genes are listed.
Figure 5. Tissue-specific selection on gene regulation.
Examples of expression patterns that are consistent with the action of directional selection on gene regulation in the human liver (A), kidney (B), or heart (C) and the action stabilizing selection on gene regulation in the other two tissues. In the top panels, we plot the normalized log-expression intensities of all the probes for these genes from all relevant hybridizations and in the bottom panel the estimated relative log expression levels (±s.e.m). On the x-axis, HL stands for expression results from human liver; HK - human kidney; HH - human heart; CL - chimpanzee liver; CK - chimpanzee kidney; CH - chimpanzee heart; RL - rhesus macaque liver; RK - rhesus macaque kidney; RH - rhesus macaque heart.
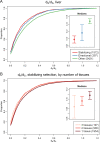
Figure 6. Protein evolution and selection on gene regulation.
Cumulative distributions of dN/dS values (x-axis) of (A) genes whose regulation evolved under stabilizing selection in the liver (red), directional selection in the liver (blue), or for which we do not have evidence for selection on gene regulation in the liver (green), and (B) genes whose regulation evolved under stabilizing selection in one (pink), two (red), or three (black) tissues. The smaller panels show the dN/dS medians in the three groups. The error bars are 95% confidence intervals calculated using bootstrapping (1000 repetitions).
Similar articles
- Expression profiling in primates reveals a rapid evolution of human transcription factors.
Gilad Y, Oshlack A, Smyth GK, Speed TP, White KP. Gilad Y, et al. Nature. 2006 Mar 9;440(7081):242-5. doi: 10.1038/nature04559. Nature. 2006. PMID: 16525476 - Natural selection on gene expression.
Gilad Y, Oshlack A, Rifkin SA. Gilad Y, et al. Trends Genet. 2006 Aug;22(8):456-61. doi: 10.1016/j.tig.2006.06.002. Epub 2006 Jun 27. Trends Genet. 2006. PMID: 16806568 Review. - Sex-specific and lineage-specific alternative splicing in primates.
Blekhman R, Marioni JC, Zumbo P, Stephens M, Gilad Y. Blekhman R, et al. Genome Res. 2010 Feb;20(2):180-9. doi: 10.1101/gr.099226.109. Epub 2009 Dec 15. Genome Res. 2010. PMID: 20009012 Free PMC article. - Comparative metabolomics in primates reveals the effects of diet and gene regulatory variation on metabolic divergence.
Blekhman R, Perry GH, Shahbaz S, Fiehn O, Clark AG, Gilad Y. Blekhman R, et al. Sci Rep. 2014 Jul 28;4:5809. doi: 10.1038/srep05809. Sci Rep. 2014. PMID: 25069065 Free PMC article. - Comparative primate genomics: the year of the chimpanzee.
Ruvolo M. Ruvolo M. Curr Opin Genet Dev. 2004 Dec;14(6):650-6. doi: 10.1016/j.gde.2004.08.007. Curr Opin Genet Dev. 2004. PMID: 15531160 Review.
Cited by
- Gene Duplication and Gene Expression Changes Play a Role in the Evolution of Candidate Pollen Feeding Genes in Heliconius Butterflies.
Smith G, Macias-Muñoz A, Briscoe AD. Smith G, et al. Genome Biol Evol. 2016 Sep 2;8(8):2581-96. doi: 10.1093/gbe/evw180. Genome Biol Evol. 2016. PMID: 27553646 Free PMC article. - High spatial resolution proteomic comparison of the brain in humans and chimpanzees.
Bauernfeind AL, Reyzer ML, Caprioli RM, Ely JJ, Babbitt CC, Wray GA, Hof PR, Sherwood CC. Bauernfeind AL, et al. J Comp Neurol. 2015 Oct 1;523(14):2043-61. doi: 10.1002/cne.23777. Epub 2015 Jul 14. J Comp Neurol. 2015. PMID: 25779868 Free PMC article. - Reorganization of 3D genome structure may contribute to gene regulatory evolution in primates.
Eres IE, Luo K, Hsiao CJ, Blake LE, Gilad Y. Eres IE, et al. PLoS Genet. 2019 Jul 19;15(7):e1008278. doi: 10.1371/journal.pgen.1008278. eCollection 2019 Jul. PLoS Genet. 2019. PMID: 31323043 Free PMC article. - Accounting for cis-regulatory constraint prioritizes genes likely to affect species-specific traits.
Starr AL, Gokhman D, Fraser HB. Starr AL, et al. Genome Biol. 2023 Jan 19;24(1):11. doi: 10.1186/s13059-023-02846-8. Genome Biol. 2023. PMID: 36658652 Free PMC article. - Evolutionary context of psoriatic immune skin response.
Starr I, Seiffert-Sinha K, Sinha AA, Gokcumen O. Starr I, et al. Evol Med Public Health. 2021 Dec 1;9(1):474-486. doi: 10.1093/emph/eoab042. eCollection 2021. Evol Med Public Health. 2021. PMID: 35154781 Free PMC article.
References
- Clark AG, Glanowski S, Nielsen R, Thomas P, Kejariwal A, et al. Positive selection in the human genome inferred from human-chimp-mouse orthologous gene alignments. Cold Spring Harb Symp Quant Biol. 2003;68:471–477. - PubMed
- Bustamante CD, Fledel-Alon A, Williamson S, Nielsen R, Hubisz MT, et al. Natural selection on protein-coding genes in the human genome. Nature. 2005;437:1153–1157. - PubMed
Publication types
MeSH terms
Substances
LinkOut - more resources
Full Text Sources
Molecular Biology Databases


